Greater Moncton Market Update · July 2026. Based on CREA board data for Moncton and Area.
This month's market update is really for two people: the buyer who's ready to move right now, and the owner who's been in their home five years or more. If you bought in 2021 or 2022.
This month the Greater Moncton Real Estate market data showed some softening. That part of the headline is true. Sales fell 5.1% this July, the typical home took 38 days to sell instead of 33, and with 1,558 active listings, the most for any July since 2019, and 4.9 months of inventory, the highest July reading in eight years, buyers have more breathing room than they've had in a long time. But a headline says "softening" and lets you panic. The data tells you why, where, and whether it even applies to your street.
This month I went digging for the root cause, and from where I'm sitting there are three. One of them started five years ago, and it's the reason the recent buyer can skip this post: people who bought in the frenzy have stepped out of the market completely. Not selling, not buying. They already did both.
Is the market really softening, or is this just noise?
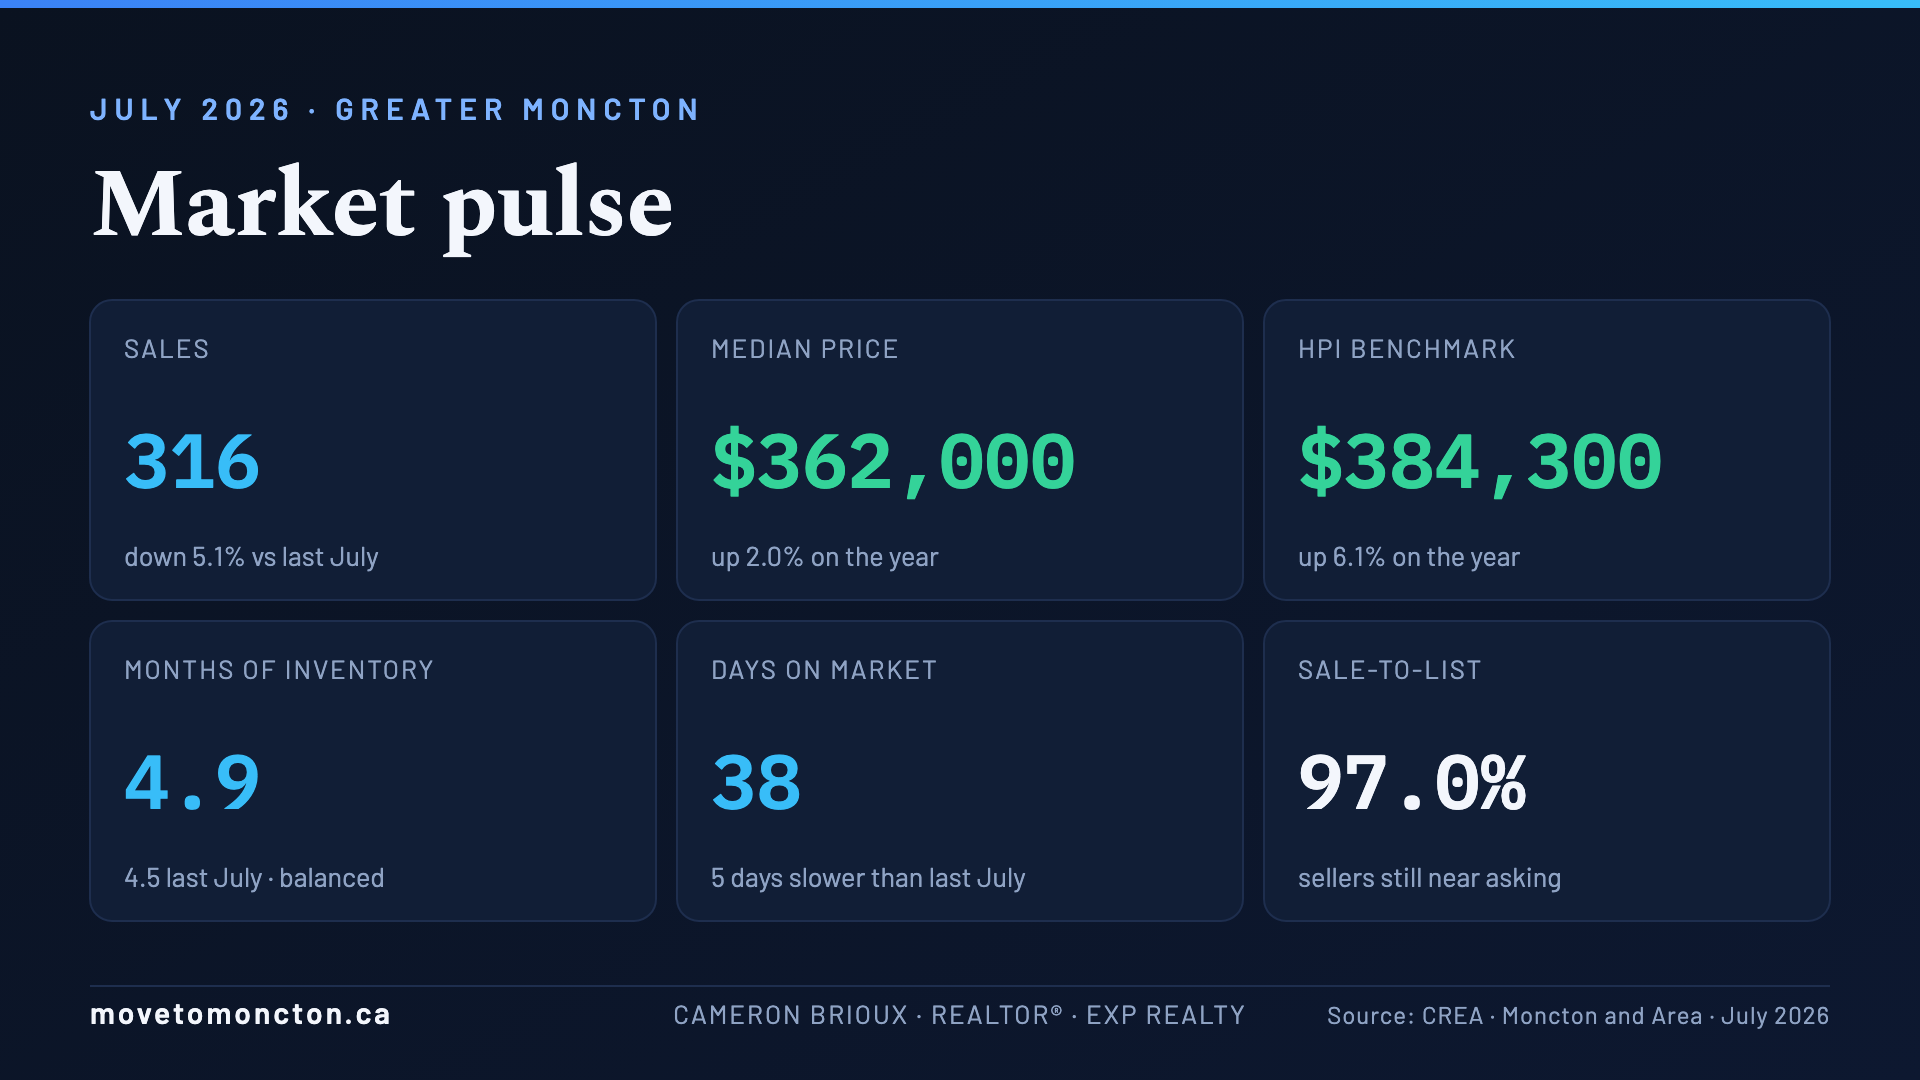
It's a real trend, and it's worth saying precisely what kind of trend it is. Sales activity slowed, and prices held. The MLS HPI composite benchmark, the number that compares the same typical home to itself over time, rose 6.1% on the year to $384,300. And remember June's scary-looking 5% one-month benchmark dip? It flattened right back out in July, up 0.1% on the month. That wobble was noise, exactly as it looked. What's happening now is different: a sustained slowdown in how many homes trade, visible in the monthly numbers and in the year-to-date figures, where sales sit 5.7% below last year.
Why is dollar volume falling while prices hold?
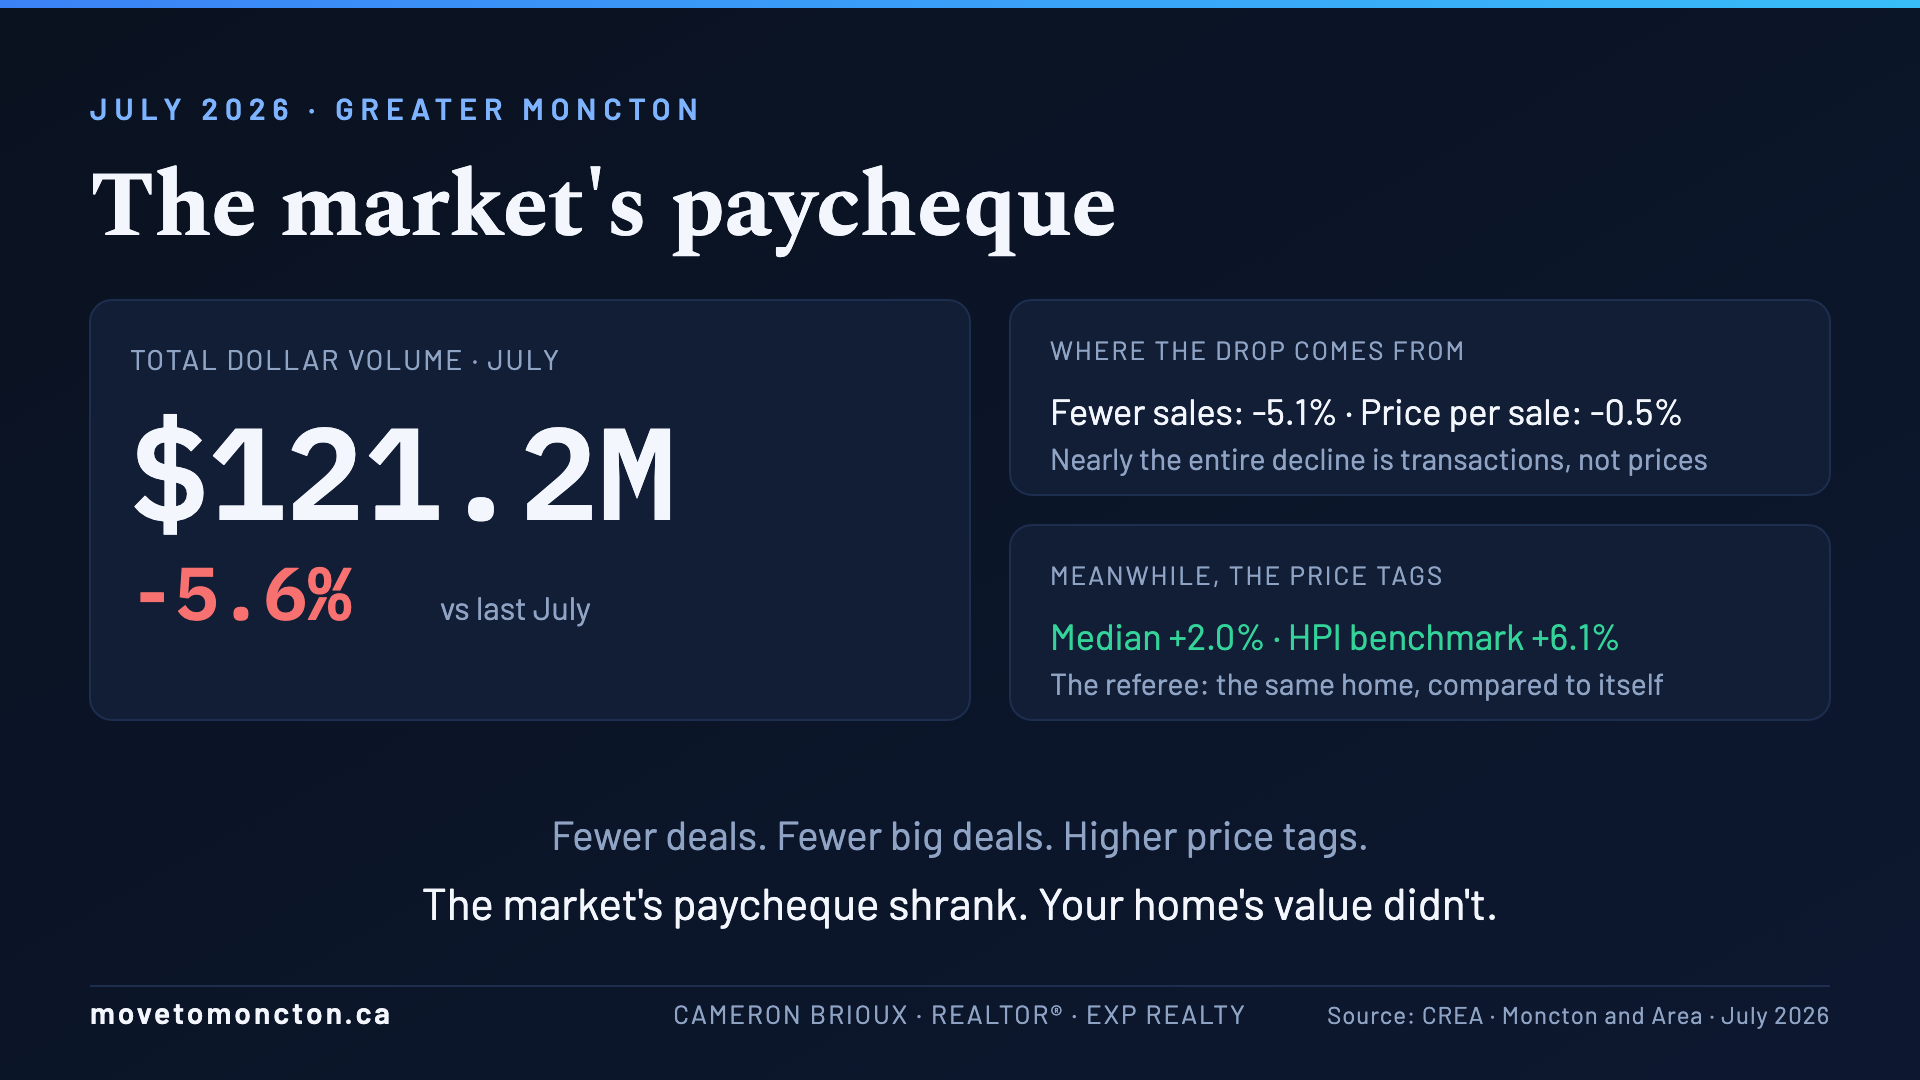
A number that is stated but not explained: total dollar volume, all the money that changed hands…I am calling it the paycheque. In July it was $121.2 million, down 5.6% from a year ago. That decline decomposes almost perfectly: sales fell 5.1% and the average price dipped just 0.5%. Nearly the entire drop is fewer transactions, with prices contributing almost nothing.
The average-versus-median split tells you which transactions went missing. The median price rose 2.0% to $362,000 while the average slipped, and when the middle rises as the average sags, the top tier of the market has thinned out. The pricier segments confirm it: sales in the Rural Routes district, where the average home runs $479,000, fell 18.5%, and semi-detached sales dropped 15.4%. Picture the market as a store. Revenue fell because it rang up fewer sales, and fewer of its most expensive items. The price tags themselves are higher than a year ago. The market's paycheque shrank. Your home's value didn't necessarily shrink.
Did interest rates cause the slowdown?
This is everyone's first answer, and the data gives rates an alibi. The Bank of Canada has held its policy rate at 2.25% for six consecutive announcements, and prime has sat at 4.45% all year, far below the 5% peak of 2024. A market doesn't soften because of something that hasn't moved. Rates do play one supporting role, which we'll get to, but they didn't pull the trigger.
Root cause one: we borrowed these sales five years ago
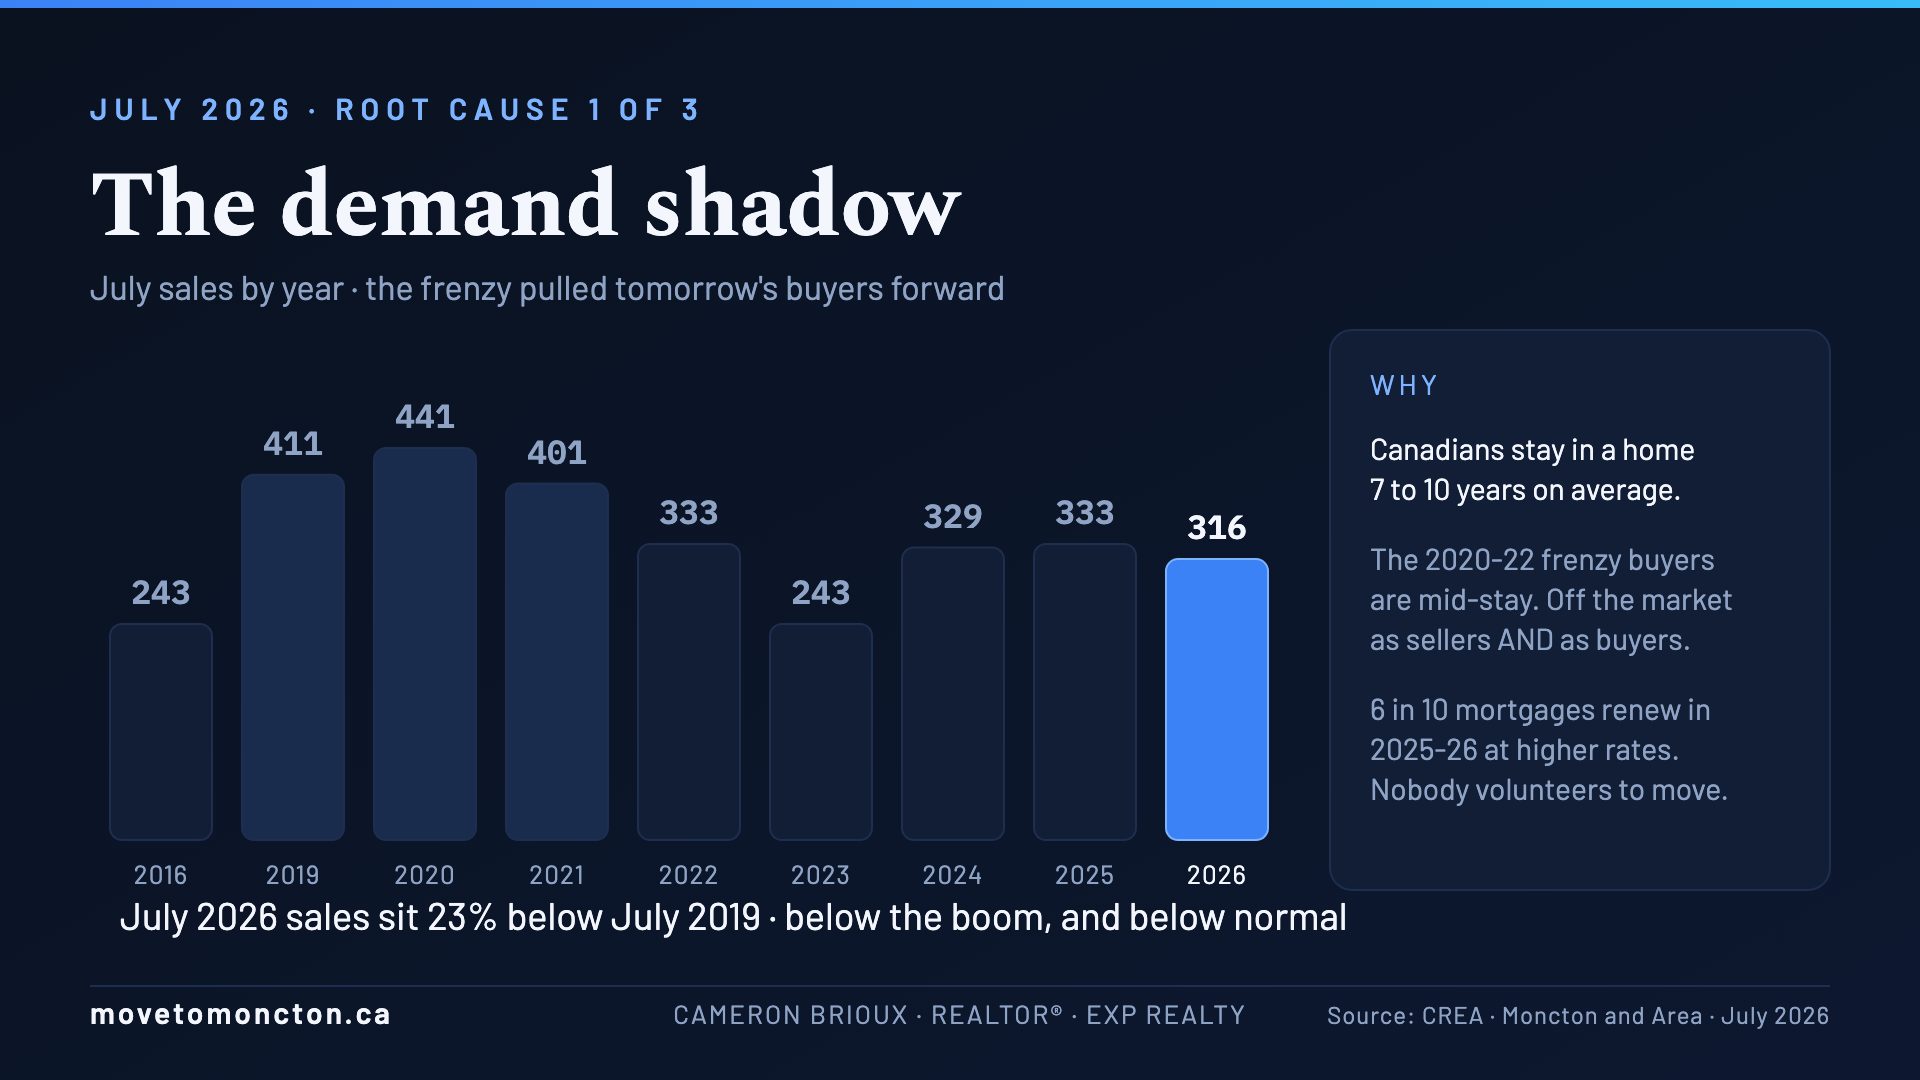
Think back to 2020 through 2022. Record migration, “2% mortgages”, homes selling in a weekend. An enormous share of this region's housing stock changed hands in about thirty months. Now add one fact: Canadians typically stay in a home for seven to ten years. Every family that bought in the frenzy is currently in year four or five of a much longer stay. They are not sellers, and they are not buyers. They already did both.
The proof is in the report's own comparison columns. July 2026 sales are 21.2% below the July 2021 frenzy, which you'd expect. But they're also 23.1% below July 2019, the pre-pandemic baseline. The market isn't merely down from the boom. It's running below normal, because the boom didn't create extra demand out of thin air. It pulled tomorrow's demand forward, and we are living in tomorrow.
Here's where rates make their cameo: roughly 60% of Canadian mortgages renew in 2025 or 2026, and owners who locked in near 2% are renewing closer to 4.5%. Nobody volunteers to move in the middle of that math. The renewal wave doesn't stop new buyers, but it anchors existing owners in place, which shrinks both the resale supply and the move-up buyer pool at once.
Root cause 2: the buyer pipeline stopped refilling
For five years, a large share of Greater Moncton's buyers were people moving in: the “Ontario wave”(lol), then newcomers to Canada. That engine has stalled. In late 2025, Statistics Canada data showed New Brunswick's population falling by more than a thousand people in a single quarter, a decline economists described as the province's largest since the 1970s. In the first quarter of 2026, more people left the province for the rest of Canada than arrived, while federal immigration cuts took net international immigration down 97.7%. For the first time in years, the province's population isn't growing.
Meanwhile, the supply side never got the memo. The City of Moncton permitted 472 new residential units in the first quarter alone, including a 17-storey downtown tower-YES, some of these are rental stock... The homes keep coming. The new buyers didn't. That mismatch lands hardest exactly where the new units land, which is why the City of Moncton posted the biggest sales decline of the three cities.
Root cause 3: the price ladder got tall
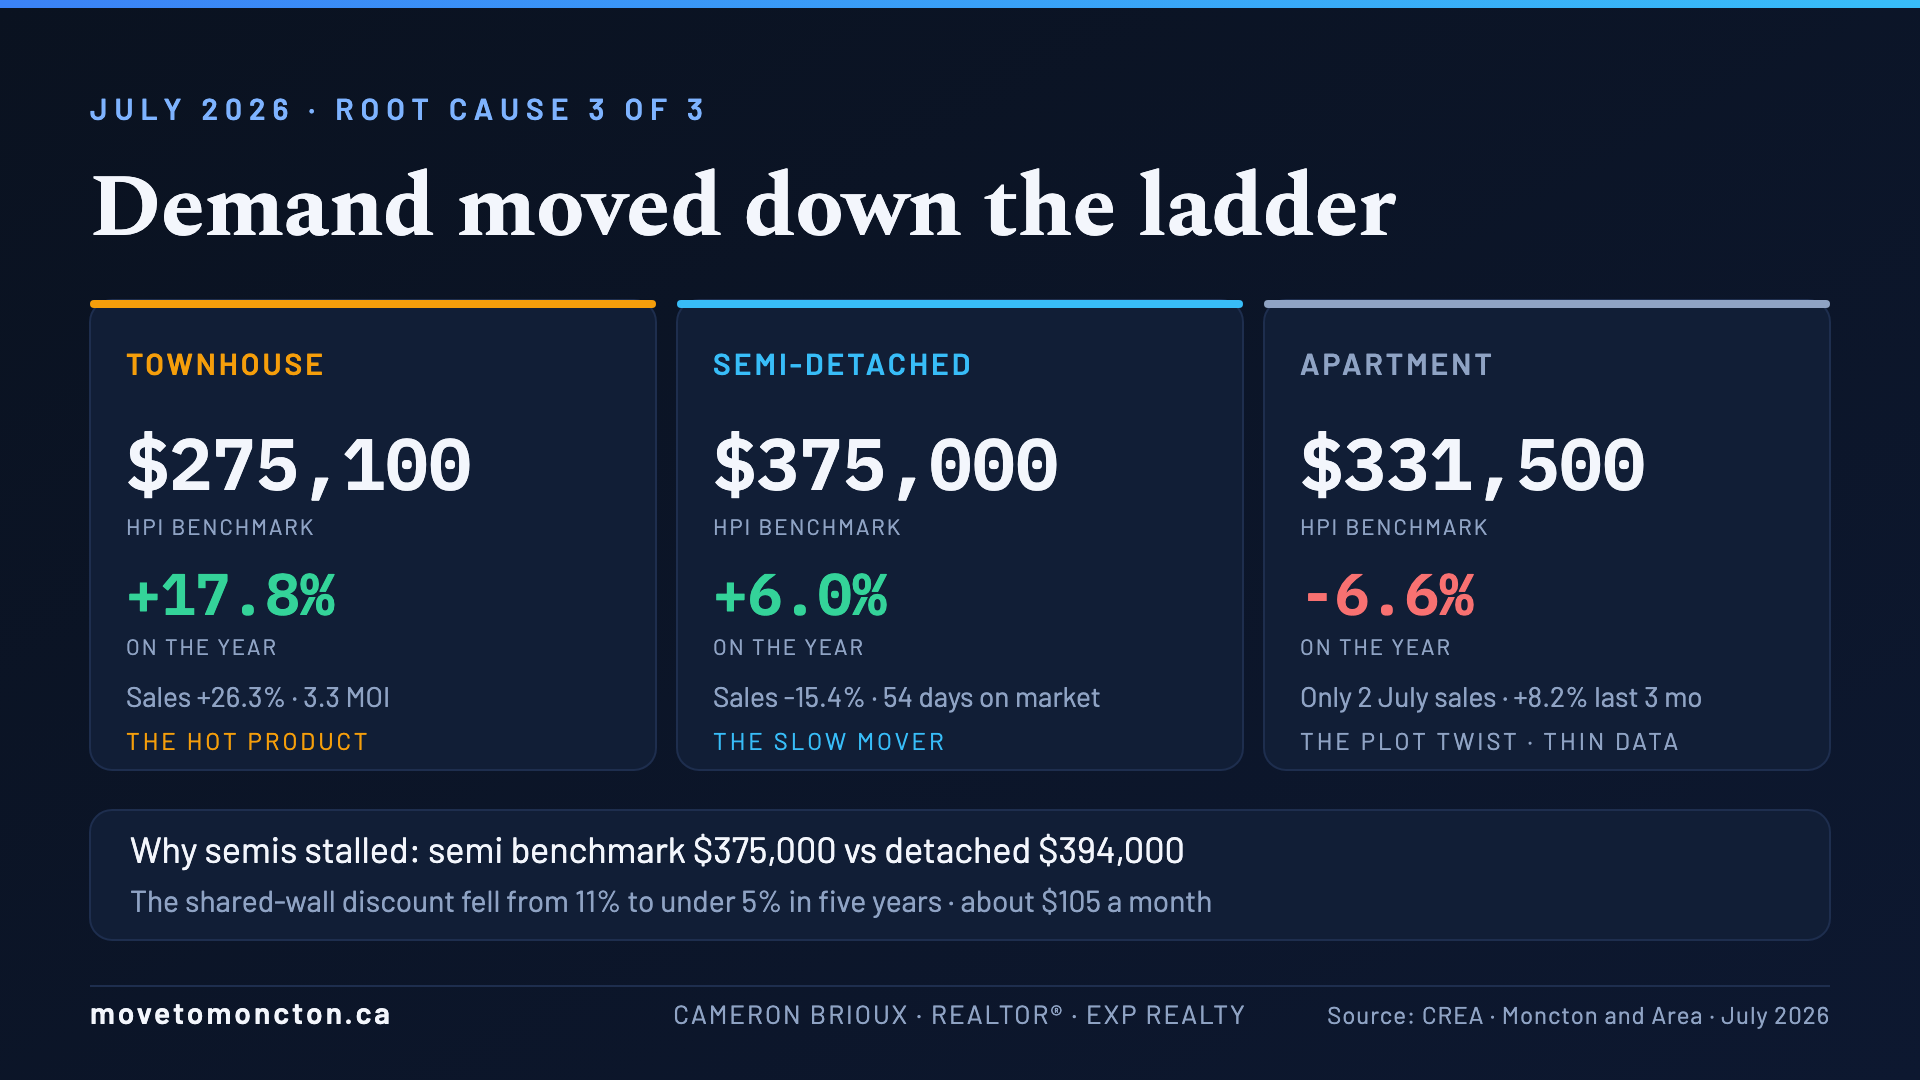
After a 45% run-up in five years, the buyers who remain are shopping a tier lower, and July made that rotation impossible to miss. Townhouse sales jumped 26.3%, and the townhouse benchmark rose 17.8% on the year to $275,100, the strongest performance of any property type. The region's most affordable ownership product is its hottest one. FYI, these have been updated in classification so the YoY is to be taken with a grain of salt. These homes have been popular with first-time buyers and downsizers.
The clearest casualty is the semi-detached. Sales fell 15.4% and days on market stretched to 54, three weeks slower than last year, even as the semi benchmark rose 6%. The reason is a collapsed discount: the semi benchmark sits at $375,000 against a single-detached benchmark of $394,000, a gap of $19,000, or under 5%. Run the same benchmarks back five years using the report's own growth figures and the discount was roughly 11%. The saving that justifies sharing a wall has been cut in half, to about a hundred dollars a month on a mortgage. Buyers looked at that math and walked one aisle over, down to townhouses or up to detached, and from where I'm sitting, some of them decided renting makes more sense for now. And one plot twist worth knowing: the apartment benchmark is the year's worst performer at -6.6%, but it's up 8.2% over the past three months, the strongest quarterly move on the board. Condos crashed through the winter and have been quietly recovering since spring, though tread carefully with this one: only two apartments actually traded in July, so the benchmark is doing the talking, not the sales volume.
So what's the full diagnosis?
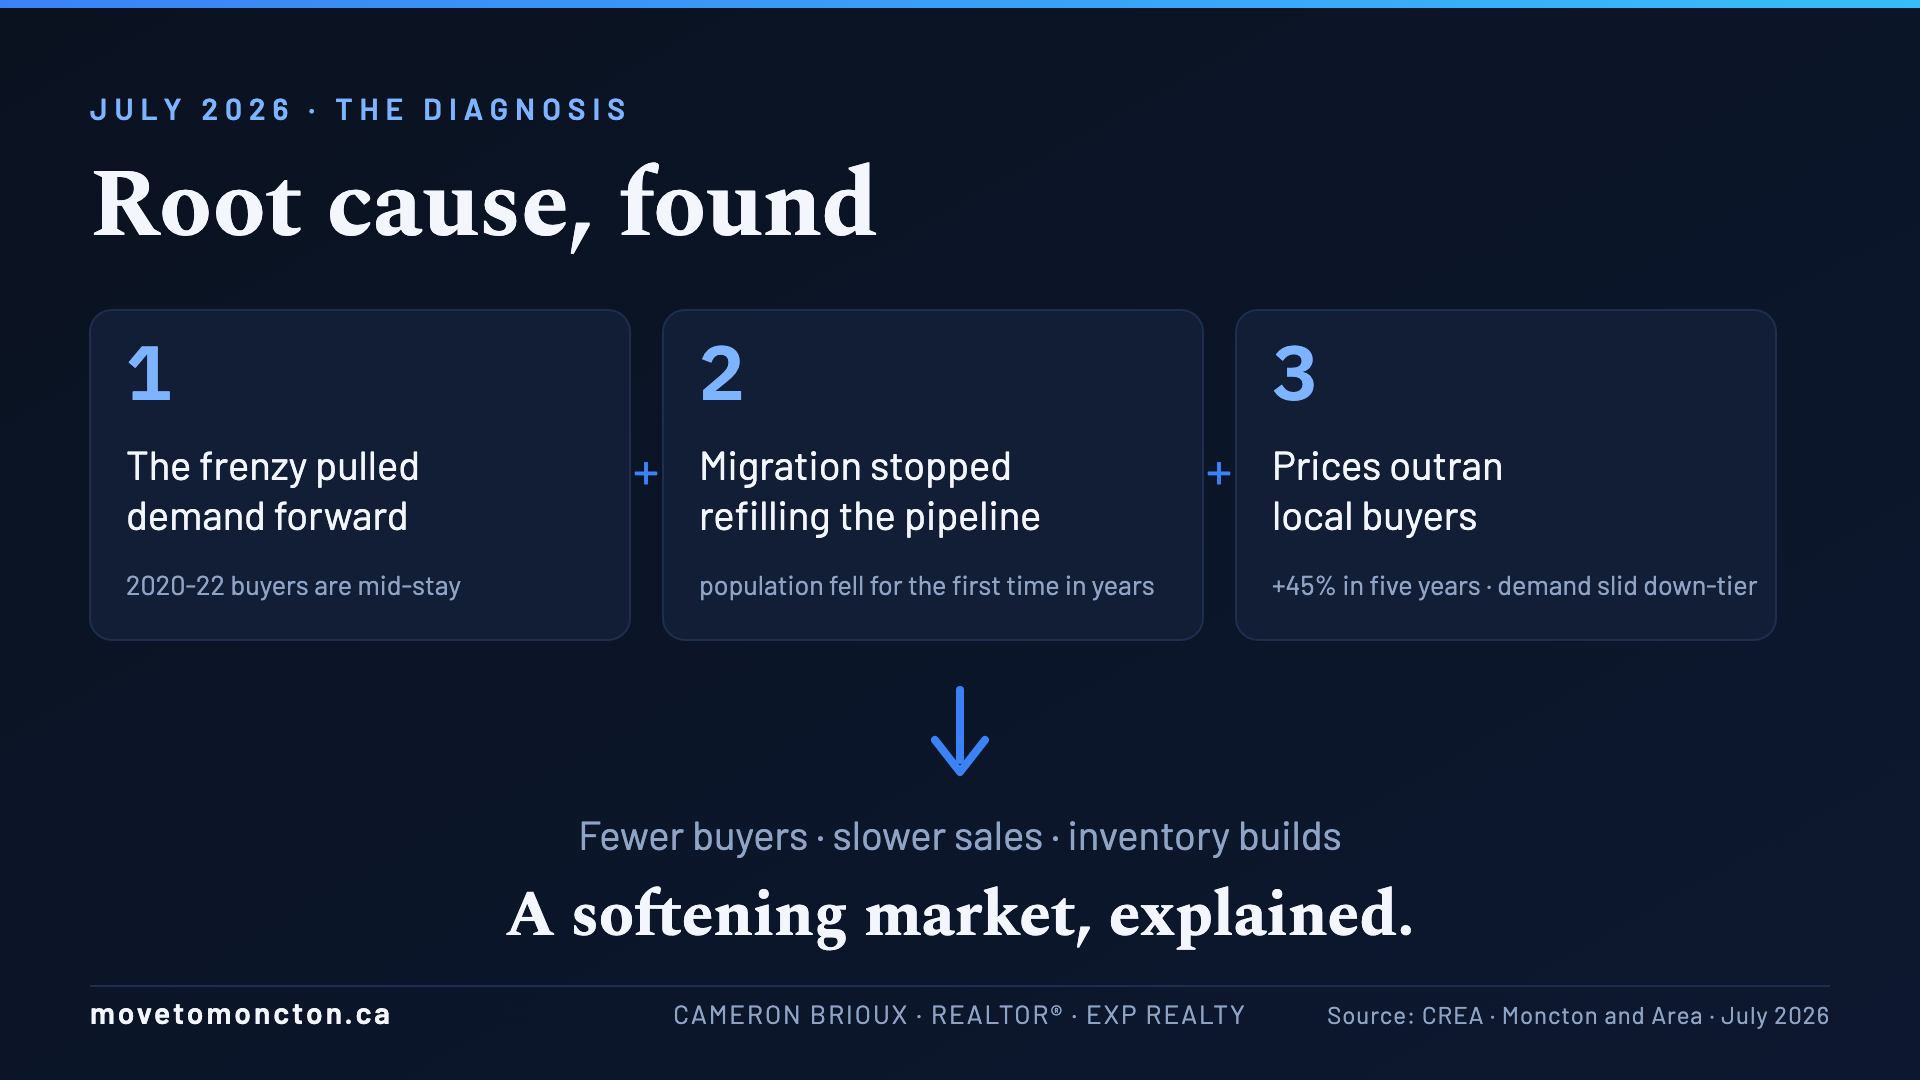
Put the three causes together and the softening explains itself. The frenzy pulled demand forward, so a huge cohort of would-be movers is parked mid-tenure. Migration stopped refilling the pipeline, so nobody is replacing them. And prices climbed past what many remaining local buyers can stretch to, so the demand that's left slid down the ladder. Fewer buyers means homes sit longer, and homes sitting longer means inventory builds. That's the whole chain, and note what's absent from it: forced selling. New listings rose just 1.8%, because nobody is being squeezed out at these rates. A market with no forced sellers has a floor under it, which is why softer demand is showing up as slower sales rather than falling prices.
Which neighbourhoods are still hot? The heat matrix
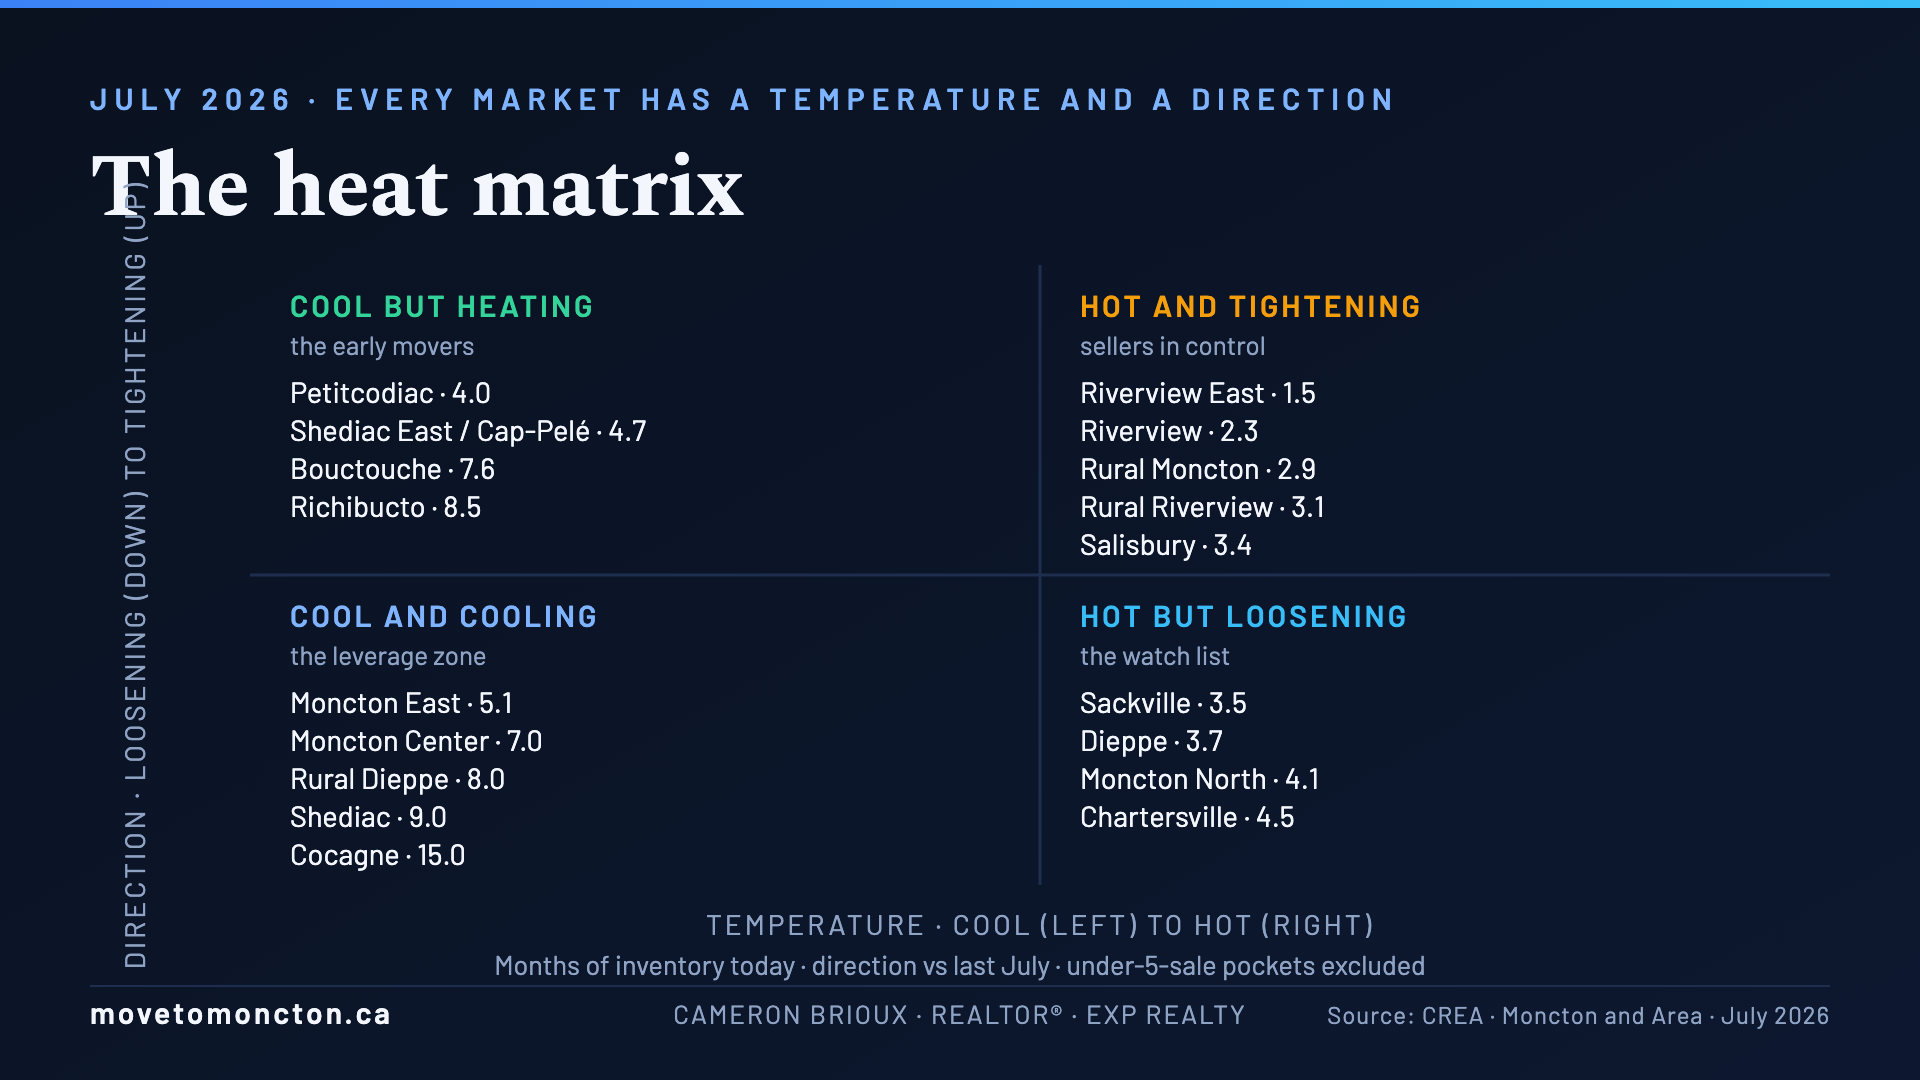
Regional averages hide everything that matters here, because this softening did not land evenly. There is no single Moncton market. It's a patchwork of micro-markets, and this month I built a better way to read it. Every neighbourhood has two properties: a temperature, meaning how much inventory it holds today, and a direction, meaning whether it's tightening or loosening compared to last July. Cross the two and every pocket in the region lands in one of four quadrants. One caution before the tour: this map reshuffles every single month. Shediac East was the region's coldest pocket in June and doubled its sales in July, so whatever the matrix says about your street today has a shelf life. That's the argument for checking in monthly, not a reason to ignore it.
Hot and tightening is seller country: Riverview East went from 4.0 months of supply to 1.5 in a year, and the town of Riverview, Rural Riverview, Rural Moncton, and Salisbury all tightened with it.
Hot but loosening is the watch list: Sackville slid from 2.1 months to 3.5, Dieppe drifted from 3.0 to 3.7 even as its median hit $412,400, up a full 15%, and Moncton East posted the sharpest slide on the board, 2.9 to 5.1.
Cool but heating holds the surprises: Shediac East and Cap-Pelé, last month's coldest pocket, doubled their sales and tightened from 8.5 months to 4.7.
And cool and cooling is the leverage zone: Moncton Center at 7.0 months, Shediac at 9.0, Rural Dieppe at 8.0, and Cocagne out at 15.0.
Why did the softening skip Riverview?
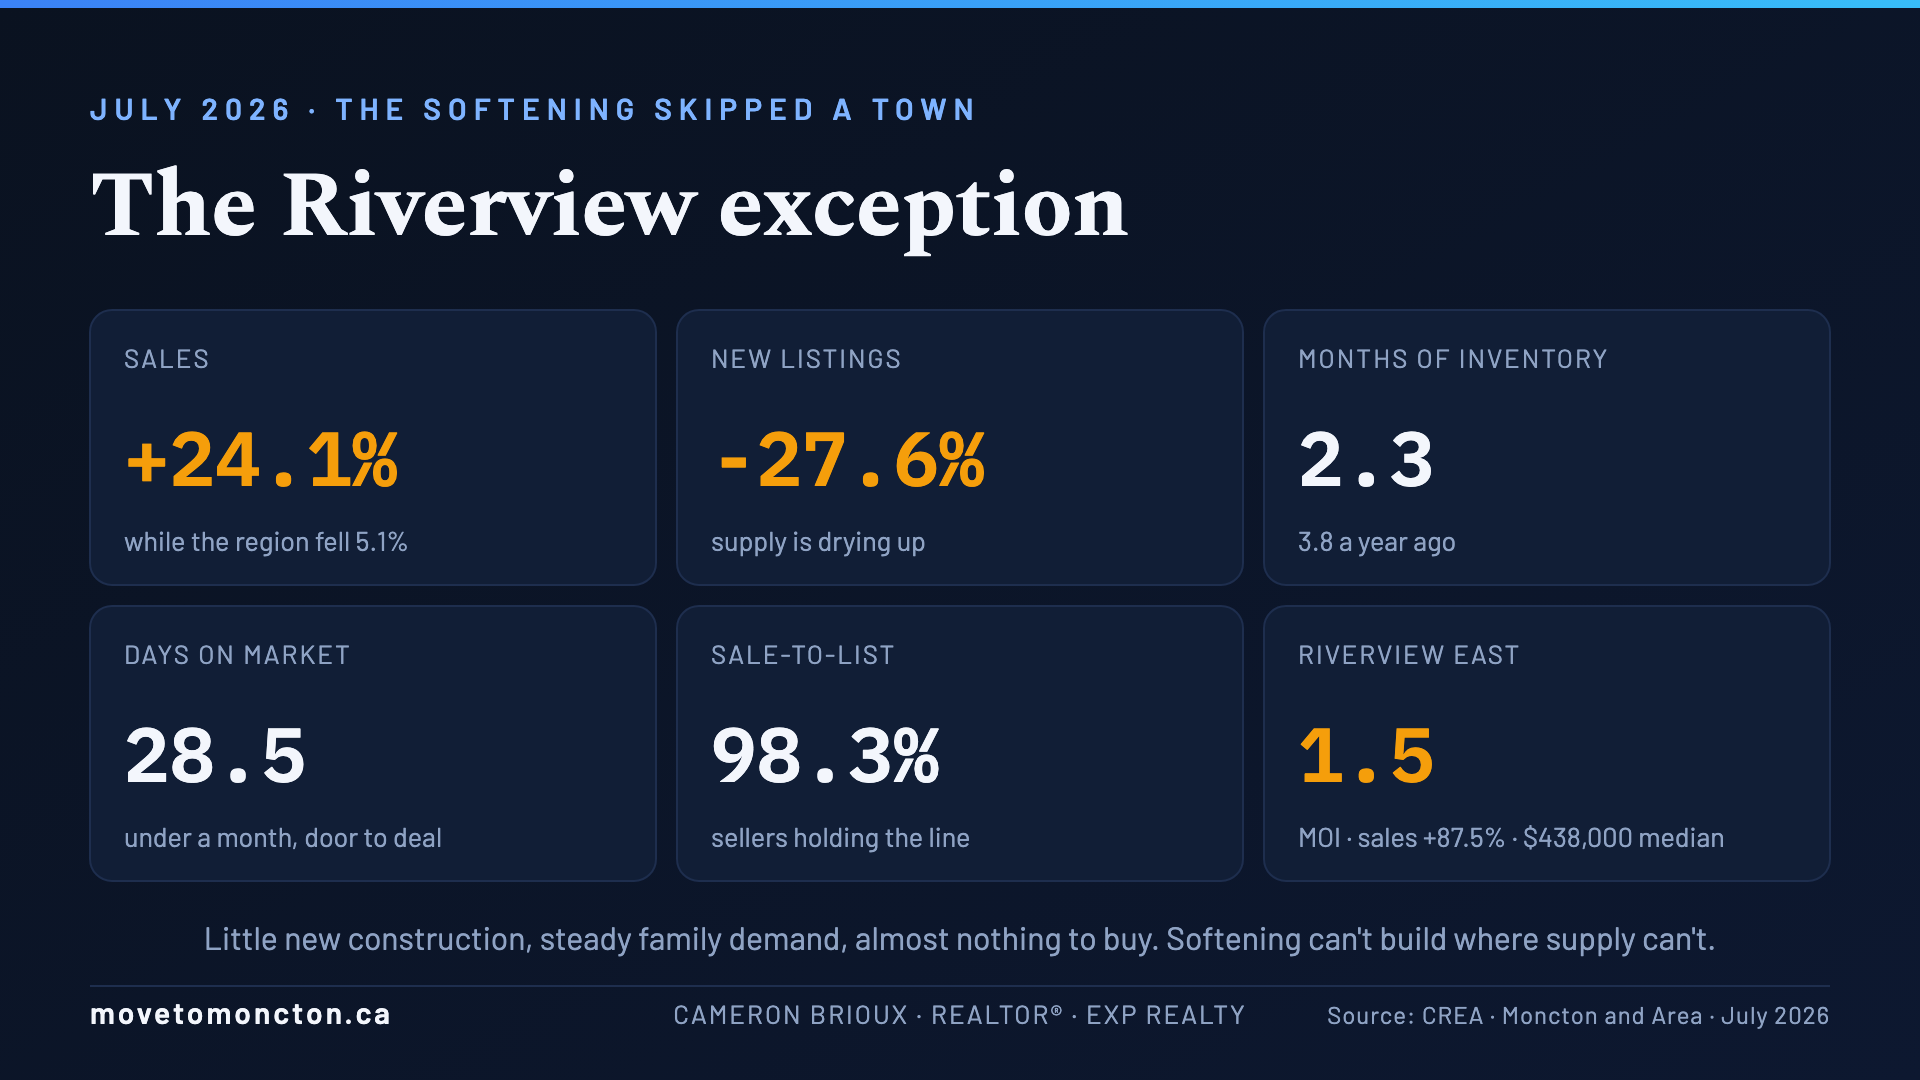
Riverview is the exception that proves the root cause. While regional sales fell 5.1%, Riverview sales jumped 24.1%. New listings there dropped 27.6%. The whole town sits at 2.3 months of inventory with homes selling in under a month at 98.3% of asking, and Riverview East is the single hottest pocket in the entire 365-page report: 1.5 months of supply, sales up 87.5%, more homes sold than newly listed, and a median of $438,000, up 19.2% on the year. The explanation maps straight onto the diagnosis: very little new construction, steady family demand, and almost nothing to buy. Where supply can't accumulate, softening can't either.
What this means for the two people it's for
Back to our two people.
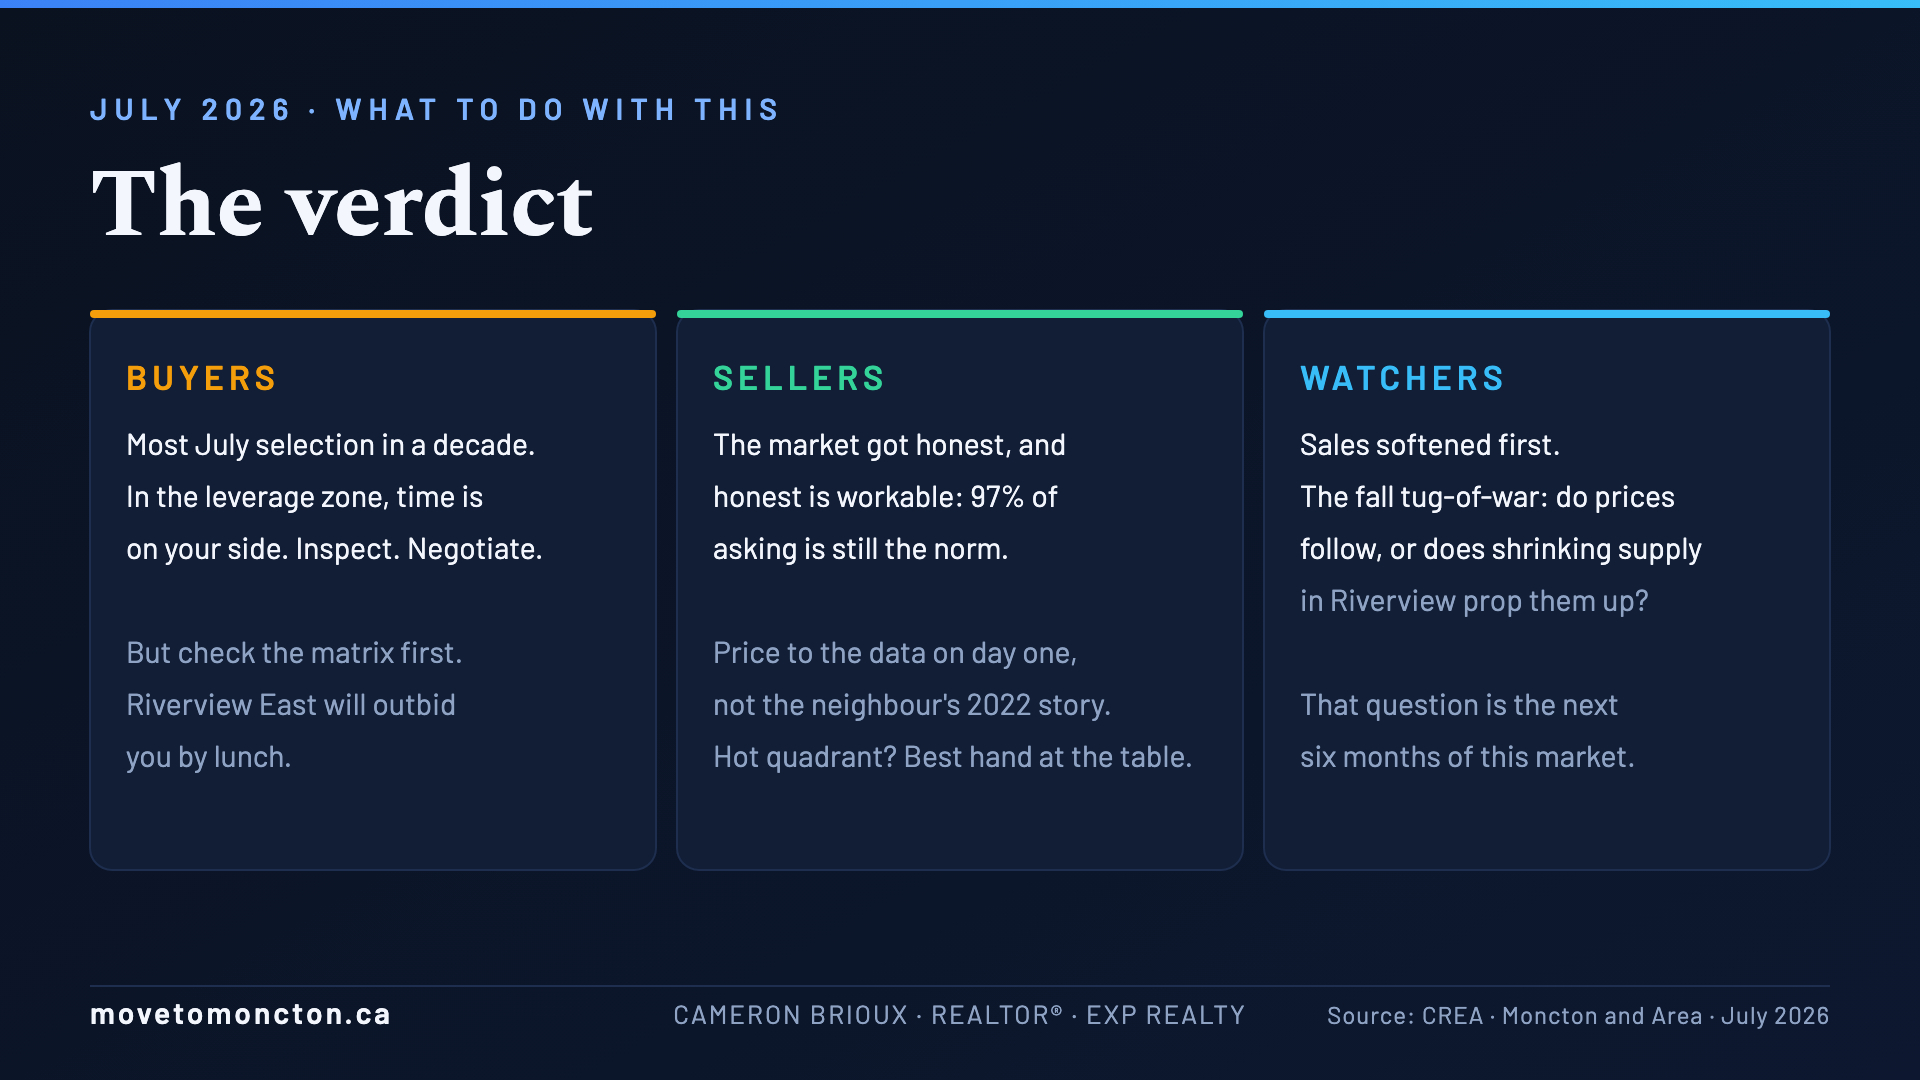
If you're ready to buy right now, this is the most selection a July has offered you in eight years, and you're competing against fewer buyers than at any point in the last five. In the leverage zone, time is on your side: inspect, negotiate, breathe. Just check the matrix before you strategize, because walking into Riverview East expecting a discount is a fast way to lose a house by lunch.
If you've owned five years or more, you're the seller this market still works for. You're sitting on roughly 45% of benchmark growth, which means equity and options the 2021 buyer doesn't have. But you're also listing into the most July inventory in eight years, so the game is pricing to the data on day one rather than a neighbour's 2022 story. Homes priced right are still fetching 97% of asking, and sellers in the tightening quadrant are holding the best hand at the table.
And if you're watching from the sidelines, track one tug-of-war this fall: sales softened first, and the question is whether prices follow or whether tight supply in pockets like Riverview keeps them propped up. That question is the next six months of this market.
Frequently asked questions about the Moncton market
Is the Greater Moncton real estate market softening in 2026?
Yes. In July 2026, sales fell 5.1% year over year to 316, homes took 38 days to sell versus 33 a year earlier, and inventory reached 4.9 months, the highest July level in eight years. Prices are holding: the MLS HPI benchmark rose 6.1% on the year to $384,300. It is a slowdown in activity, not a decline in home values.
Why is the Moncton market slowing down?
Three causes. First, the 2020 to 2022 buying frenzy pulled years of future demand forward, and those owners are now mid-tenure and off the market. Second, New Brunswick's population growth stalled: Statistics Canada data showed the province's population falling by over 1,000 in a single quarter in late 2025, a drop economists called the largest since the 1970s, and in early 2026 more people left the province than arrived. Third, after a 45% five-year price run-up, remaining demand rotated to cheaper property types.
Did interest rates cause the Moncton slowdown?
No. The Bank of Canada held its policy rate at 2.25% for six consecutive decisions through July 2026, and prime stayed at 4.45% all year. A market does not soften because of something that has not moved. The renewal wave plays a secondary role: about 60% of Canadian mortgages renew in 2025 or 2026, which discourages existing owners from moving.
Are home prices in Moncton falling?
No. The July 2026 median price rose 2.0% year over year to $362,000 and the HPI composite benchmark rose 6.1% to $384,300. The average price dipped 0.5%, but that reflects fewer high-end sales in the mix, not falling values. June 2026's 5% one-month benchmark dip flattened to +0.1% in July.
What is the hottest neighbourhood in Greater Moncton right now?
Riverview East. In July 2026 it held just 1.5 months of inventory, sales rose 87.5% year over year, more homes sold than were newly listed, and the median price reached $438,000, up 19.2% on the year. The town of Riverview overall sits at 2.3 months of inventory with sales up 24.1% while new listings fell 27.6%.
Where do buyers have the most leverage in Greater Moncton?
The cool-and-cooling quadrant: Moncton Center at 7.0 months of inventory, Shediac at 9.0, Rural Dieppe at 8.0, and Cocagne at 15.0. The City of Moncton overall loosened to 5.2 months with sales down 16.1%, partly because new construction supply is concentrated there.
Why are semi-detached homes selling slowly in Moncton?
The discount collapsed. The semi-detached benchmark is $375,000 against a single-detached benchmark of $394,000, a gap of $19,000 or under 5%, down from roughly 11% five years ago. With the saving for sharing a wall cut in half, buyers moved down to townhouses or stretched to detached homes. Semi sales fell 15.4% and days on market hit 54.
What is the best-performing property type in Greater Moncton?
Townhouses. The townhouse benchmark rose 17.8% year over year to $275,100, the strongest of any property type, with sales up 26.3% and just 3.3 months of inventory. As the region's most affordable ownership product, townhouses absorbed the demand that slid down the price ladder.
Is now a good time to buy a house in Moncton?
It depends on your pocket. Regionally, buyers have 1,558 active listings, the most for any July since 2019, and 4.9 months of inventory, the highest July level in eight years. In the leverage zone (Moncton Center, Shediac, Cocagne, Rural Dieppe) buyers can negotiate. In tightening pockets like Riverview East and Riverview West, competition remains strong and waiting has a cost. Check your specific micro-market before deciding.
Should I sell my Moncton home in a softening market?
Sellers are still receiving 97% of asking price on average, so well-priced homes are selling. The key is pricing to current data rather than 2022 comparables. Sellers in tightening pockets such as Riverview hold a strong position, with fewer competing listings and steady demand.
Make your move with data, not headlines
A regional average would have hidden almost everything in this article, and that's the whole reason I read all 365 pages every month. If you're one of the two people this report was for, a buyer ready now or an owner five years in, don't guess. Let's find out what your specific micro-market is doing before you make a move.
thank you for reading!
Cameron Brioux · REALTOR® · eXp Realty · movetomoncton.ca. On a mission to help 1,000 people make informed Greater Moncton real estate decisions this year. Data source: CREA, Moncton and Area Residential Market Activity and MLS® HPI Report, July 2026. Population and migration figures from Statistics Canada. Bank of Canada policy rate as of July 15, 2026. Data reflects information available at publication and might not be perfect, but it's what we've got. This article is market information, not individual financial advice.