Greater Moncton market report · September 2026. Published October 2, 2026. Data: CREA Moncton and Area MLS® report.
The short answer
Greater Moncton recorded 229 home sales in September 2026, down 26.1% from September 2025 and the lowest September total in the 2016 to 2026 data. New listings reached 472, the most of any September in that period, and active listings climbed to 1,575. Prices held roughly flat year over year: the median sale price was $360,000 (up 1.1%) and the MLS® HPI composite benchmark was $377,400 (up 0.4%), although the benchmark is down 6.3% from March. Months of inventory rose to 6.9, giving buyers more leverage than at any September since 2018.
What happened in September 2026?
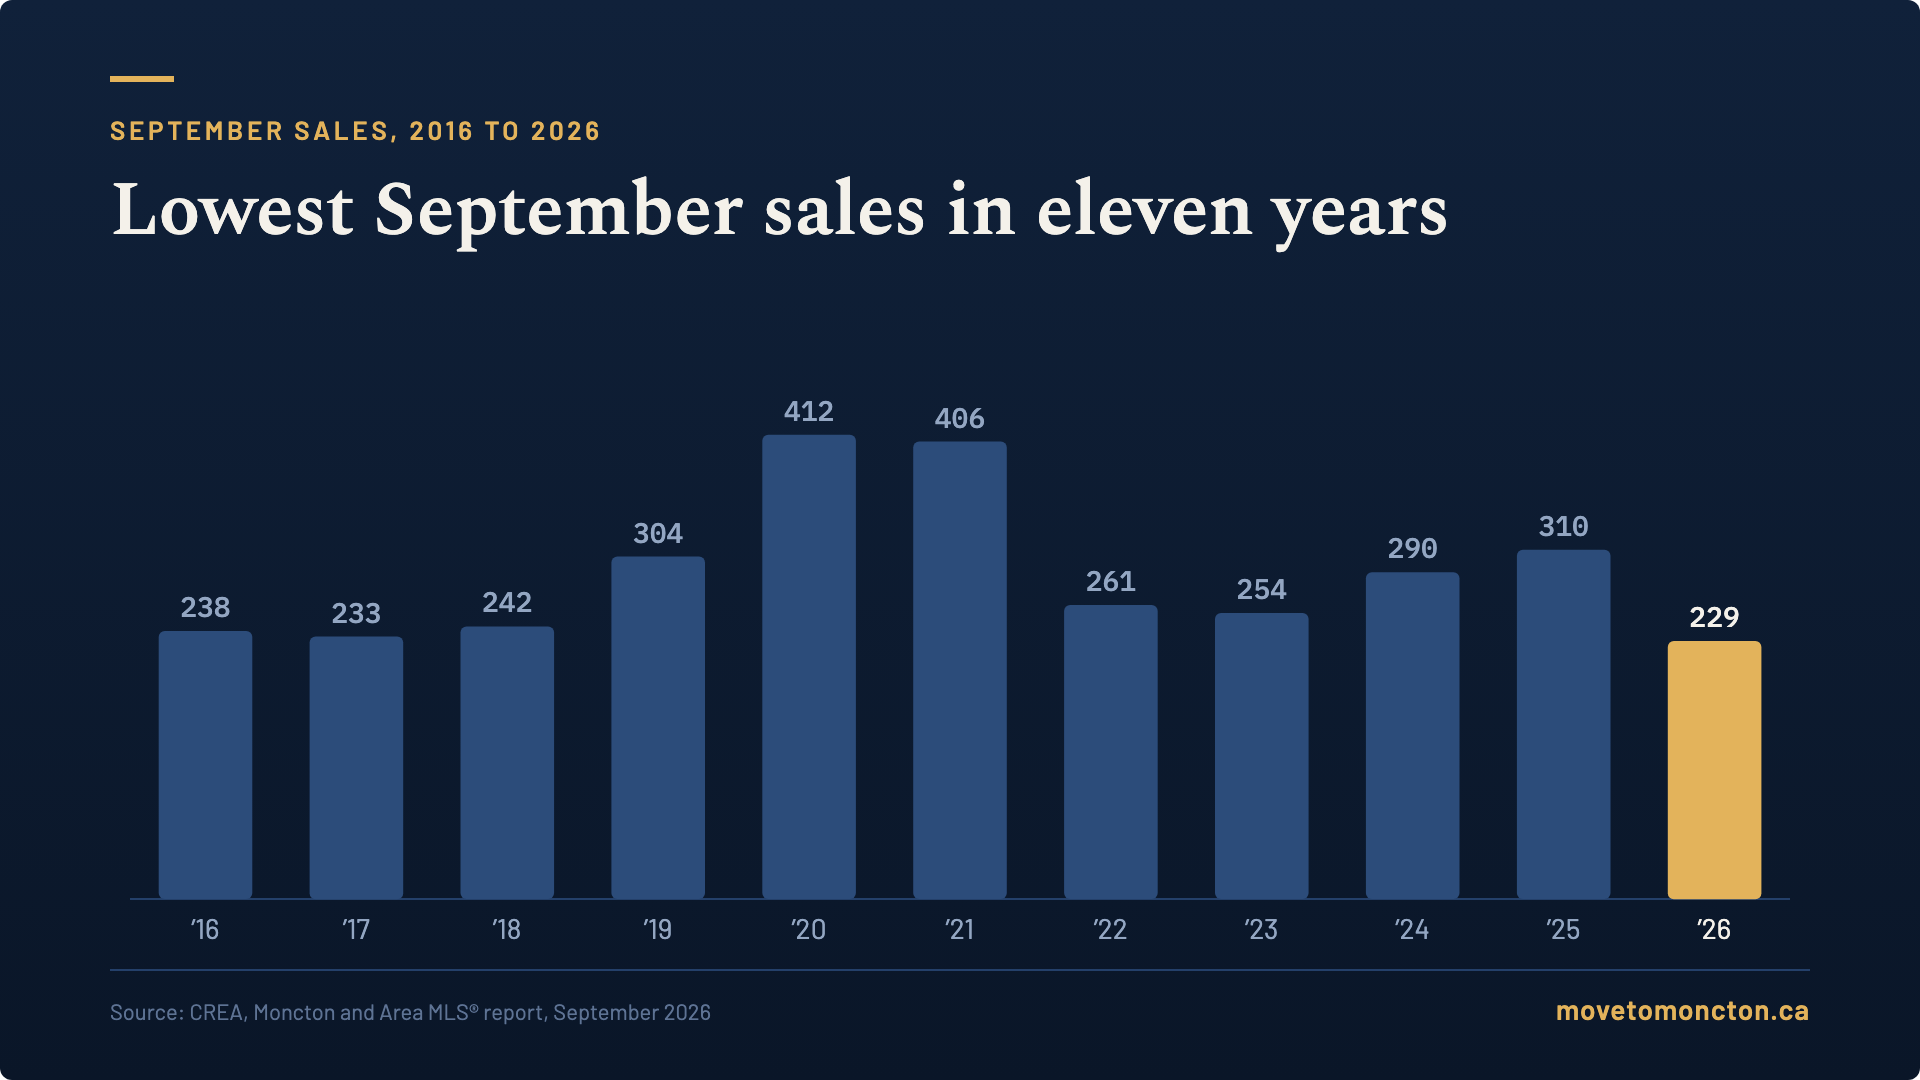
Buyers slowed down and sellers kept listing. The 229 sales in September were 81 fewer than the 310 recorded in September 2025, and fewer than any September going back to 2016. At the same time, 472 new listings came to market, up 3.1% from last year. Active listings ended the month at 1,575, up 8.7%, which is the most homes for sale at the end of a September since 2019.
That combination pushed months of inventory, the time it would take to sell every active listing at the current pace, up to 6.9 from 4.7 a year ago. You have to go back to September 2018 (7.7 months) to find a higher September reading.
Here is the part that often gets missed. The homes that did sell went for about the same money as last year, and they sold slightly faster: the median days on market was 51, compared with 53 in September 2025. This was a slower month for demand, and prices have not collapsed.
Which Greater Moncton neighbourhoods slowed down the most?
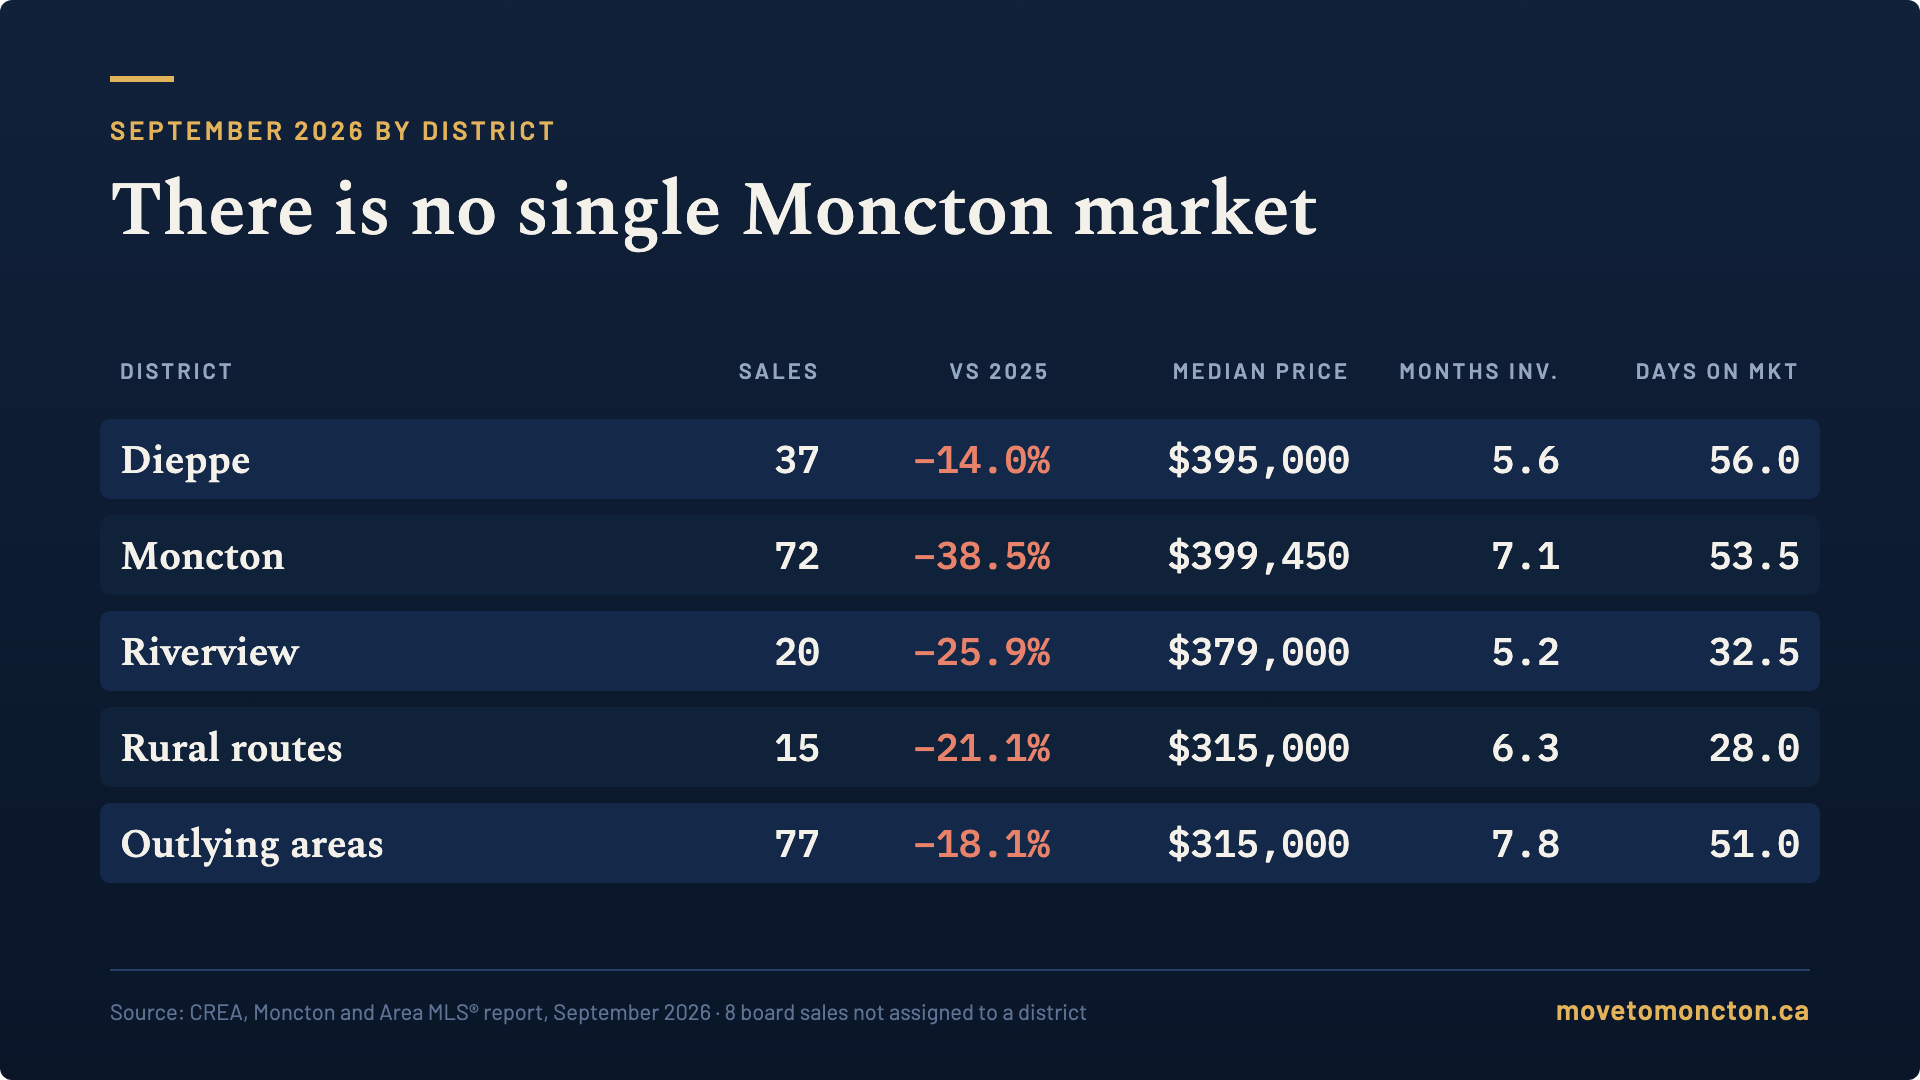
There is no single Moncton market, and September showed that clearly. The city of Moncton carried most of the slowdown, while Dieppe and Riverview held up better.
Moncton North
Moncton North had 25 sales, down from 47 last September, a drop of 46.8% and the steepest of the four Moncton sub-areas. New listings rose 30.6% to 64, and months of inventory went from 2.9 to 6.2 in a year. The median sale price was $442,500, down 1.7%.
Moncton Center
Moncton Center ended September with 212 active listings, up 43.2% from a year ago, and 9.2 months of inventory, the highest of the Moncton sub-areas. There were 23 sales (37 last September) and the median price was $338,000, down 1.5%.
Riverview East
Riverview East moved in the opposite direction. It had 8 sales, close to last year's 9, while active listings fell 40% to just 18. That works out to 2.3 months of inventory and a median of 28.5 days on market. Riverview as a whole sold faster than Moncton or Dieppe, with a median of 32.5 days on market.
Dieppe: Chartersville and Fox Creek
Dieppe had the smallest sales decline of the three cities at 14%, and it is the only district with more sales year to date than in 2025 (up 0.8%). The median sale price in Dieppe was $395,000. Inside Dieppe, Chartersville doubled its sales to 14 from 7, while Fox Creek fell to 7 sales from 19 and sits at 9.4 months of inventory.
Shediac and the outlying areas
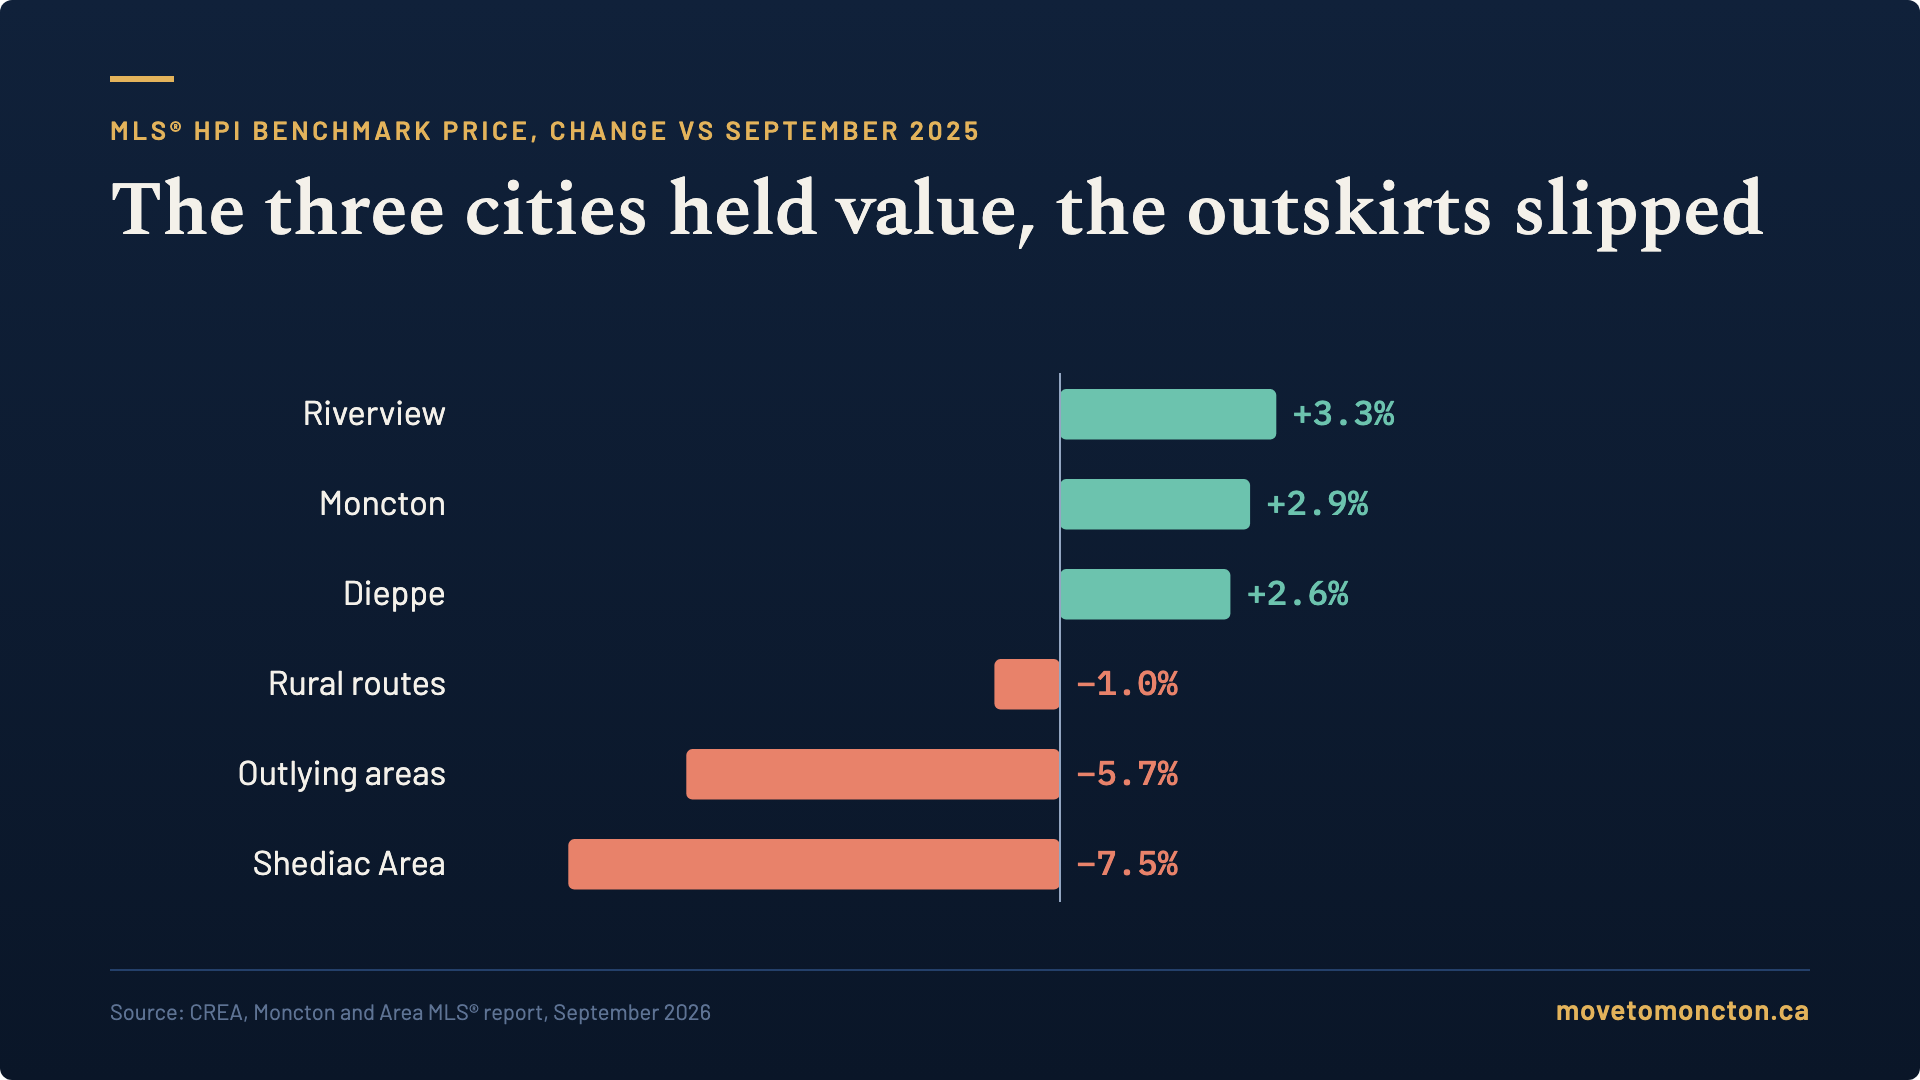
Outside the three cities, active listings were down 3.5% and homes sold faster than last year (51 days versus 66.5). Prices are softer, though. The MLS® HPI benchmark for the outlying areas is down 5.7% year over year, and Shediac Area is down 7.5% with 9 months of inventory.
Neighbourhood numbers are a monthly snapshot. Several sub-areas have only a handful of sales in a given month, so a single unusual sale can move the median noticeably.
Are home prices going down in Moncton?
It depends which price number you look at, and over what time frame.
- Median price: $360,000, up 1.1% from September 2025.
- Average price: $367,626, down 3.3%.
- MLS® HPI composite benchmark: $377,400, up 0.4% from a year ago and down 6.3% from six months ago.
Compared to last year, prices are essentially flat. Compared to the spring, they are lower. The benchmark is down 1.7% over the past three months, which means most of the six-month decline happened between March and June. The data does not predict what comes next, but the pace of the decline has slowed.
The bigger split is geographic. Benchmark prices in Riverview (+3.3%), Moncton (+2.9%) and Dieppe (+2.6%) are all up year over year, while the outlying areas are down 5.7%.
What about semi-detached homes?
Semi-detached homes have been one of the stronger segments of 2026, with 367 sales year to date, up 17.6%. September was a different story: 28 semi sales, down 42.9%, while new semi listings jumped 64.3% to 69. Active semi listings are up 21.7% to 174. Right now more semis are coming to market than buyers are absorbing.
Is it a good time to buy a home in Greater Moncton?
Buyers have more negotiating room than they have had in several years. Homes sold for an average of 96.2% of list price in September, compared with 96.9% last September and 98.4% in September 2024. On a $360,000 list price, 96.2% works out to roughly $13,700 below asking. With 6.9 months of inventory, buyers can take time on conditions, inspections and closing dates.
That room is not evenly spread. Moncton Center, Fox Creek and Moncton North have the most inventory right now. Riverview East is still tight, so buyers there should be prepared to move quickly.
Should I sell my house in Moncton now?
If you have owned for five years or more, the composite benchmark is still up 36.5% compared to September 2021, so most long-term owners are sitting on meaningful equity even after the spring pullback. The challenge is competition. With 1,575 active listings, buyers compare everything, and the sale-to-list ratio shows they are negotiating. Pricing accurately from the first day, based on your specific sub-area rather than the regional headline, matters more this fall than it has in years.
Year-to-date picture
From January through September 2026, Greater Moncton recorded 2,368 sales, down 8.4% from the same period in 2025. The year-to-date median price is $362,000 (up 0.6%), and year-to-date months of inventory is 5.1, compared with 4.4 a year ago.
Frequently asked questions
How many homes sold in Greater Moncton in September 2026?
229 homes sold through the MLS® System in Greater Moncton in September 2026, down 26.1% from 310 in September 2025. It was the lowest September sales total in the 2016 to 2026 data.
What is the median home price in Moncton in September 2026?
The median sale price for Greater Moncton was $360,000 in September 2026, up 1.1% from September 2025. The MLS® HPI composite benchmark price was $377,400.
Are house prices dropping in Moncton?
Year over year, prices are roughly flat: the composite benchmark is up 0.4%. Compared with March 2026 the benchmark is down 6.3%, with most of that decline happening between March and June. Benchmark prices are up in Moncton, Dieppe and Riverview, and down 5.7% in the outlying areas.
Is Greater Moncton a buyer's market right now?
Conditions moved in buyers' favour in September 2026. Months of inventory rose to 6.9 from 4.7, the sales-to-new-listings ratio fell to 48.5% from 67.7%, and homes sold for an average of 96.2% of list price. Conditions vary by neighbourhood: Moncton Center had 9.2 months of inventory while Riverview East had 2.3.
How long does it take to sell a house in Moncton?
The median days on market for Greater Moncton was 51 days in September 2026, compared with 53 days in September 2025. Riverview sold fastest of the three cities at a median of 32.5 days.
Which Moncton neighbourhood has the most homes for sale?
Within the city of Moncton, Moncton Center had the most active listings at the end of September 2026, with 212 homes for sale, up 43.2% from a year earlier, and 9.2 months of inventory.
Want the numbers for your street?
Every month I go through the full CREA report for Greater Moncton so buyers, sellers and people relocating from out of province can make decisions with real neighbourhood data. If you are thinking about a move in Moncton, Dieppe or Riverview, reach out or watch the full September breakdown on YouTube at @CameronBriouxHousing.
Source: Canadian Real Estate Association, Moncton and Area Residential Market Activity and MLS® Home Price Index Report, September 2026, prepared for the New Brunswick REALTORS® association. Figures reflect data collected on the first calendar day of the month and may be revised. Cameron is a REALTOR®️ at eXp Realty in New Brunswick. No results are guaranteed.