Greater Moncton's real estate market is shifting. The data from February 2026 tells a story of transition - not collapse, not crisis, but a meaningful recalibration that sellers, buyers, and homeowners all need to understand. Expired listings are surging, days on market are climbing, and inventory is at levels we haven't seen in years. But the headline numbers only tell part of the story. Let's dig into the data, district by district, metric by metric, and figure out what it actually means for you.
What Does "Expired Listing" Actually Mean in Greater Moncton?
Before we get into the numbers, let's clarify what an expired listing actually is. When a homeowner signs a listing agreement with a real estate agent, that agreement has a defined term - typically three to six months in the Greater Moncton market. During that window, the agent markets the property, arranges showings, and works to secure an offer.
When a listing reaches the end of its contract term without selling, one of three things happens: the property sells (it closes before or on the expiry date), the listing is withdrawn (the seller pulls the property off the market before the agreement ends, often for personal reasons), or the listing expires. An expired listing means the contract simply ran out of time without a sale.
In practical terms, an expired listing signals a disconnect between the asking price and what buyers in the market are willing to pay. It doesn't necessarily mean the home is flawed or undesirable. In most cases, it means the pricing strategy missed the mark relative to current buyer expectations and competing inventory.
The Numbers: How Big Is This Shift?
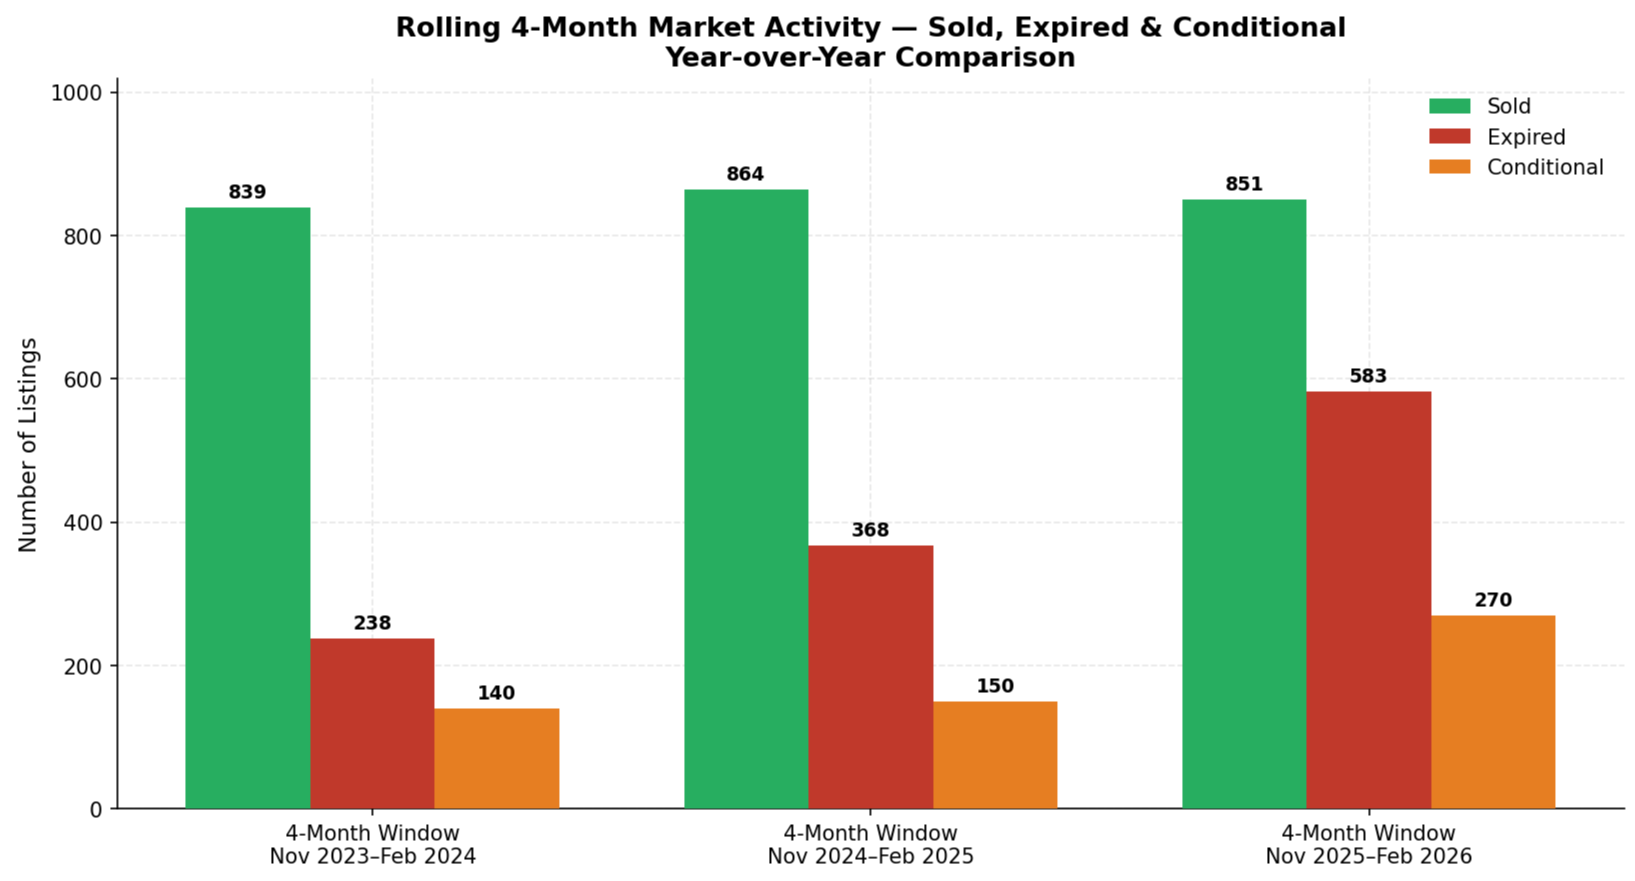
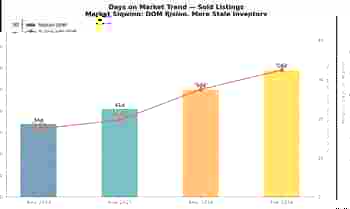
To understand the scale of the change, we need to look at the ratio of expired listings to sold listings over comparable periods. From November 2023 through February 2024, Greater Moncton saw roughly 28 expired listings for every 100 properties that sold. Fast forward to the same four-month window from November 2025 through February 2026, and that ratio has jumped to approximately 69 expired listings for every 100 sold.
That is a significant shift. Nearly one in three listings that entered the market during this period failed to sell before the listing agreement ended. This does not mean one in three homes are unsellable - many of these properties will re-list and eventually sell. But it does tell us that pricing accuracy and marketing strategy have become far more critical than they were even twelve months ago.
Of the properties that expired and then re-listed, roughly 50% came back at a reduced price. About 45% re-listed at the same price, suggesting those sellers either believe the market will come to them or are testing a new agent or marketing approach.
Greater Moncton February 2026: The Key Market Metrics
Let's look at the headline numbers for February 2026 across the Greater Moncton market. Total residential sales came in at approximately 129 units, down roughly 10% compared to February 2025. Active listings stood at 974, the highest February inventory count since 2019. That combination - fewer sales and more inventory - is the defining theme of this market right now.
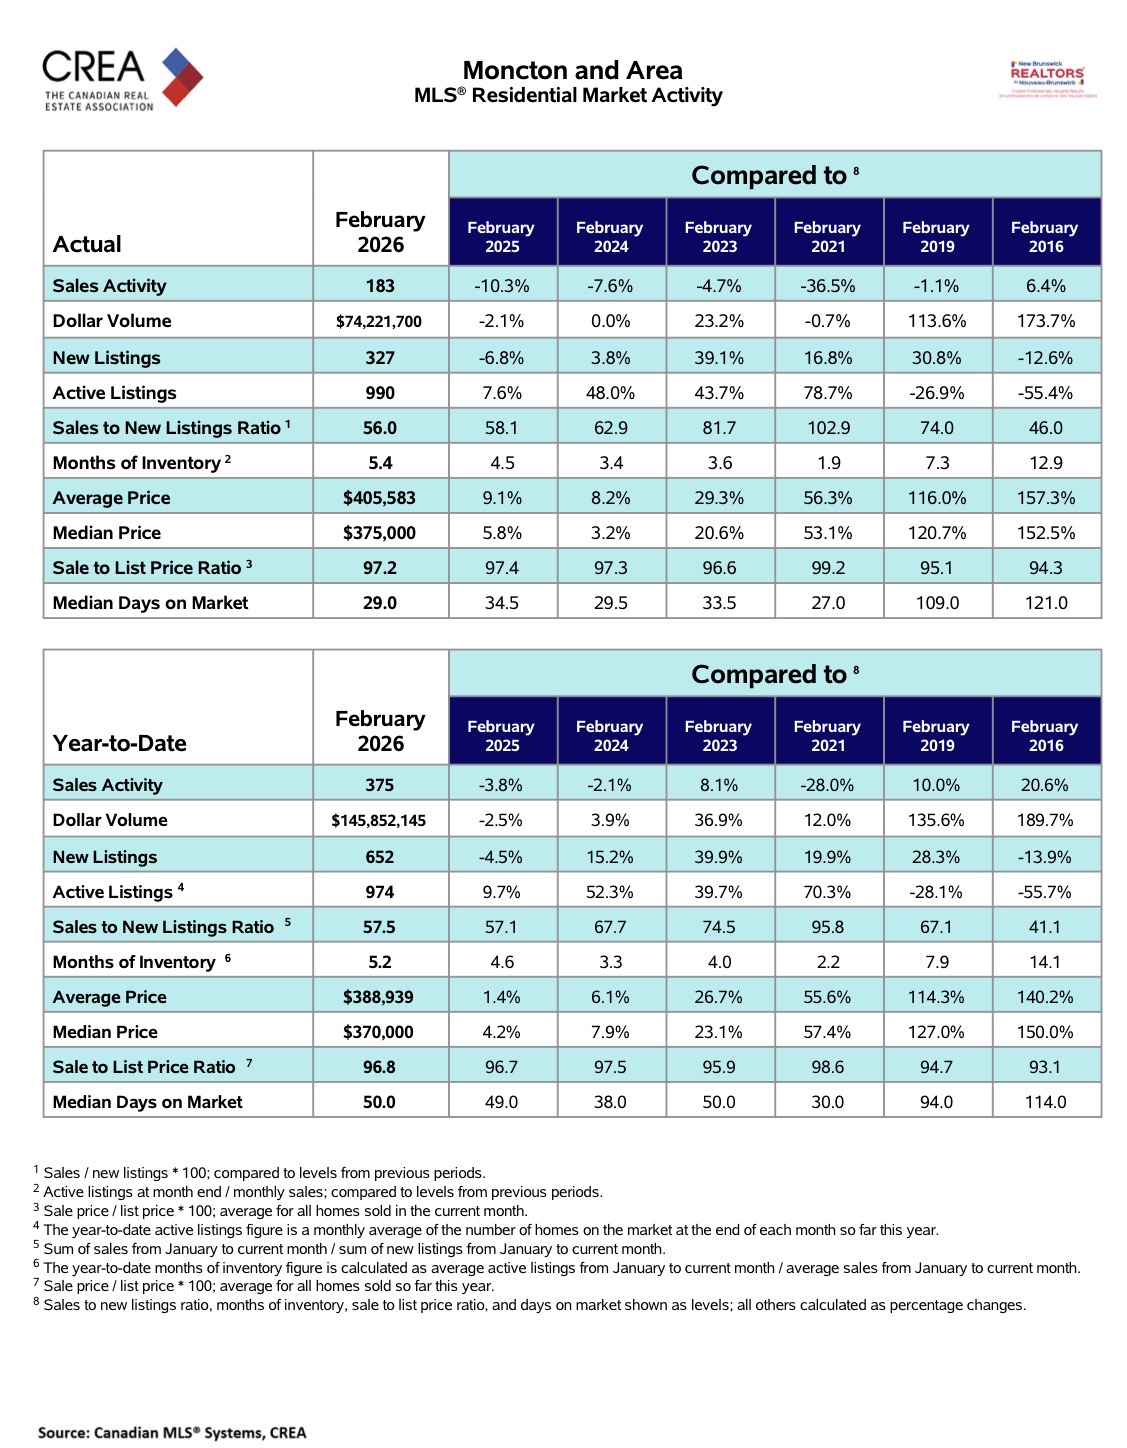
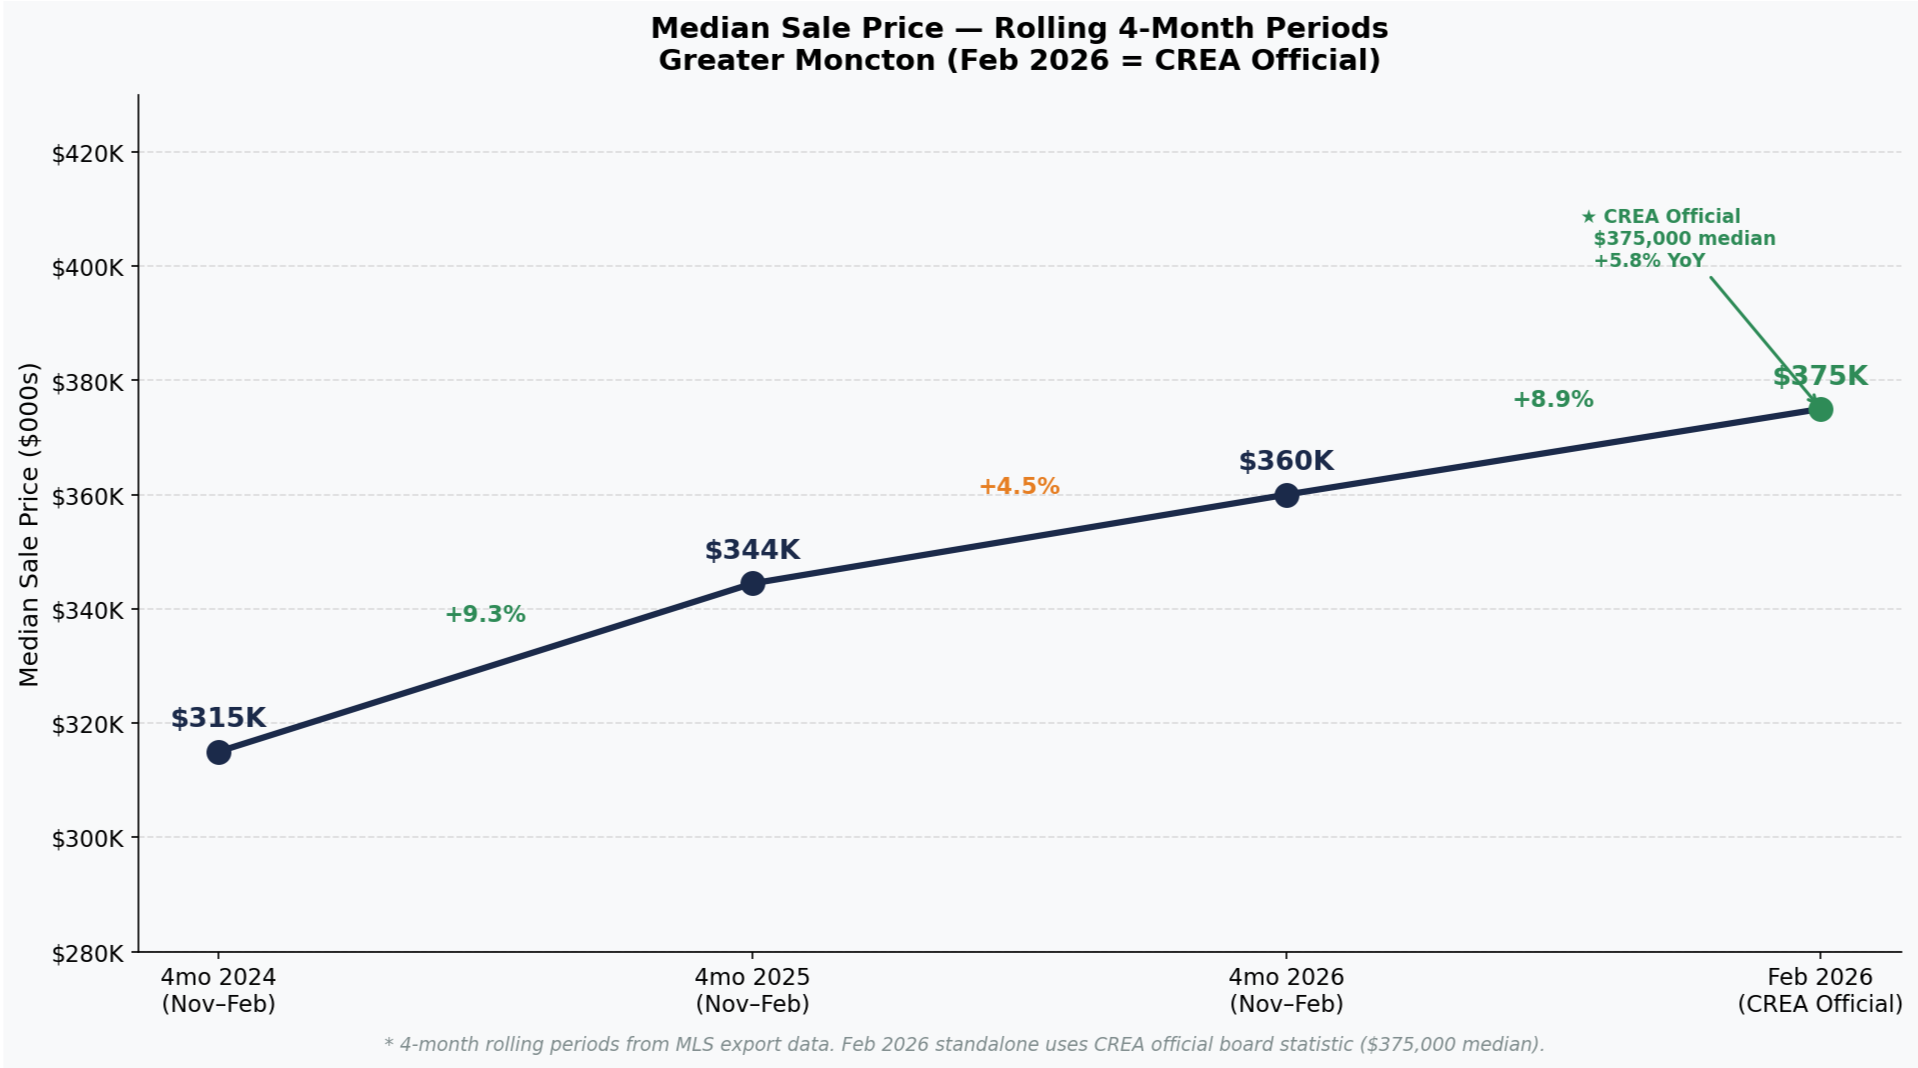
The median sale price for February 2026 landed at $375,000, representing a 5.8% increase year over year. Prices are still rising, but the pace of appreciation has moderated compared to the double-digit gains we saw in 2021 and 2022.
Months of Inventory: Where Does Greater Moncton Stand?
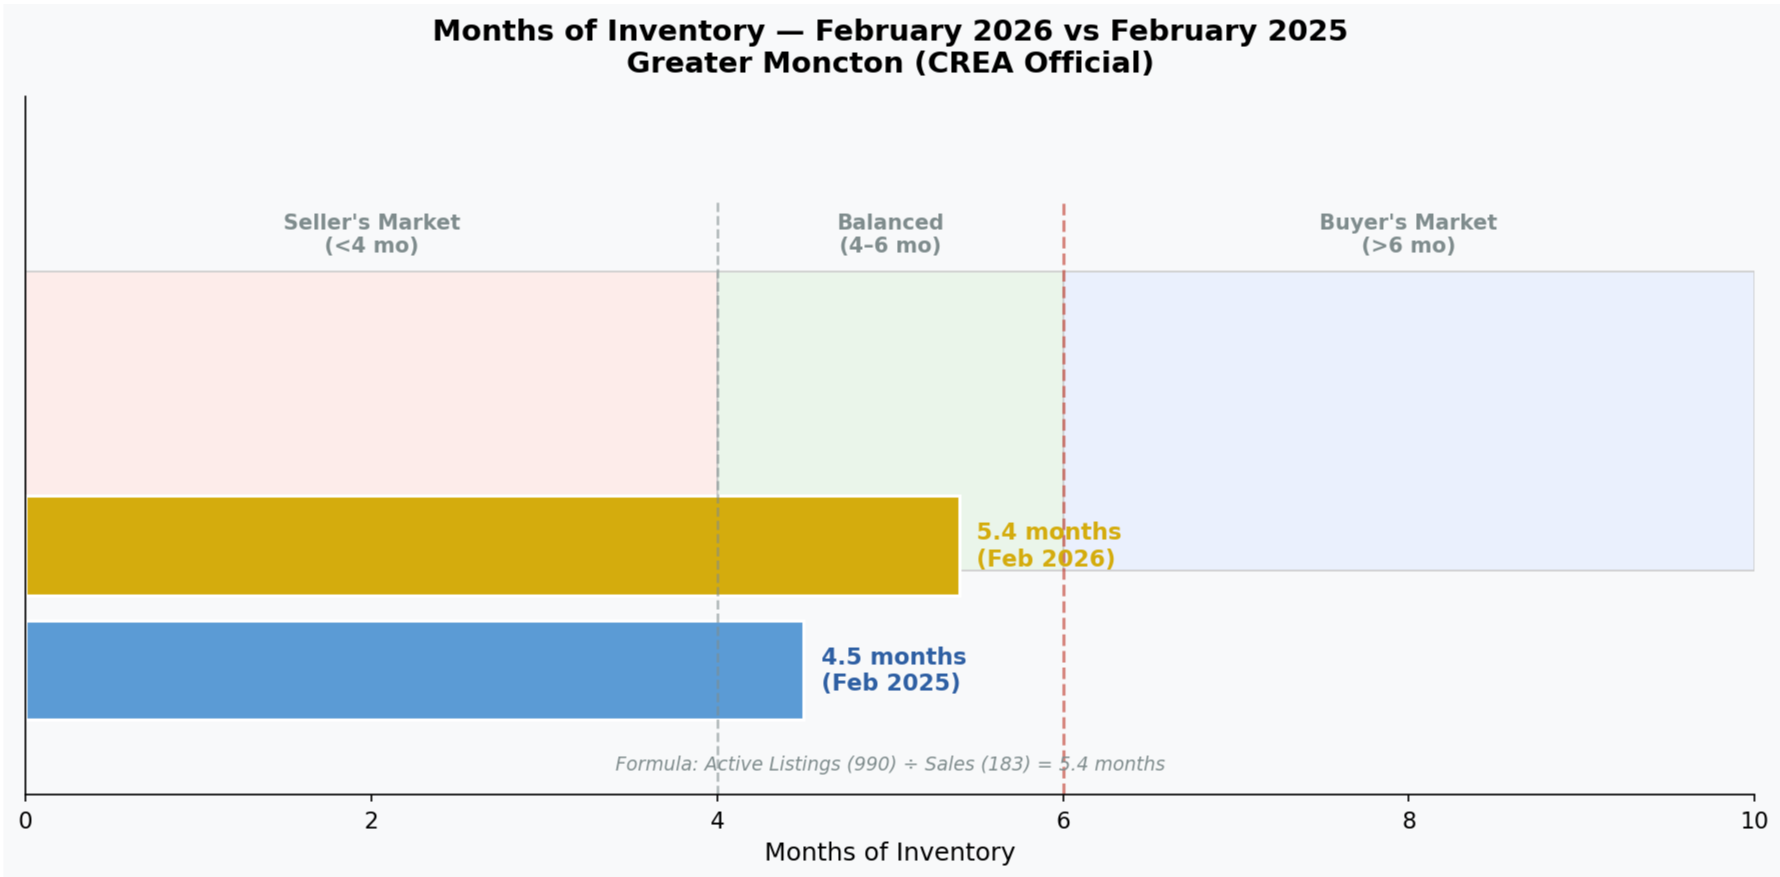
Months of inventory is one of the most important metrics for understanding market balance. It tells you how long it would take to sell all current listings at the current rate of sales, assuming no new listings entered the market. In February 2026, Greater Moncton sat at approximately 5.4 months of inventory. For reference, February 2025 was at 4.5 months.
The commonly accepted benchmarks are straightforward: below four months generally indicates a seller's market. Between four and six months is considered balanced territory. Above six months tips into buyer's market conditions.
At 5.4 months, Greater Moncton is in balanced territory but pushing toward the upper edge.

Median Price Trend: Steady Growth, but Context Matters
The median sale price for Greater Moncton has been on a steady upward trajectory, but the rate of growth is moderating. Year-over-year median price appreciation has moved from around 9.3% in early 2025 down to roughly 4.5% as of February 2026. Prices are still climbing, but they are climbing more slowly.
This moderation is healthy. Sustained double-digit price growth is not sustainable in a market where incomes are not keeping pace. The current trend suggests that sellers can still achieve strong prices, but only if they price correctly from the outset.
Days on Market Are Rising
One of the clearest indicators of a shifting market is the increase in days on market. In February 2026, nearly one-third of all completed sales had been on the market for 90 days or more before finding a buyer.
Rising days on market underscores the importance of pricing strategy. Properties that are accurately priced from day one are still selling in reasonable timeframes. But properties that enter the market above what buyers are willing to pay face a compounding problem: as a listing ages, buyer interest tends to decline. Pricing right on day one is no longer just good advice - it is essential.
District-by-District Breakdown
The Greater Moncton market is not monolithic. Conditions vary significantly from one district to another.
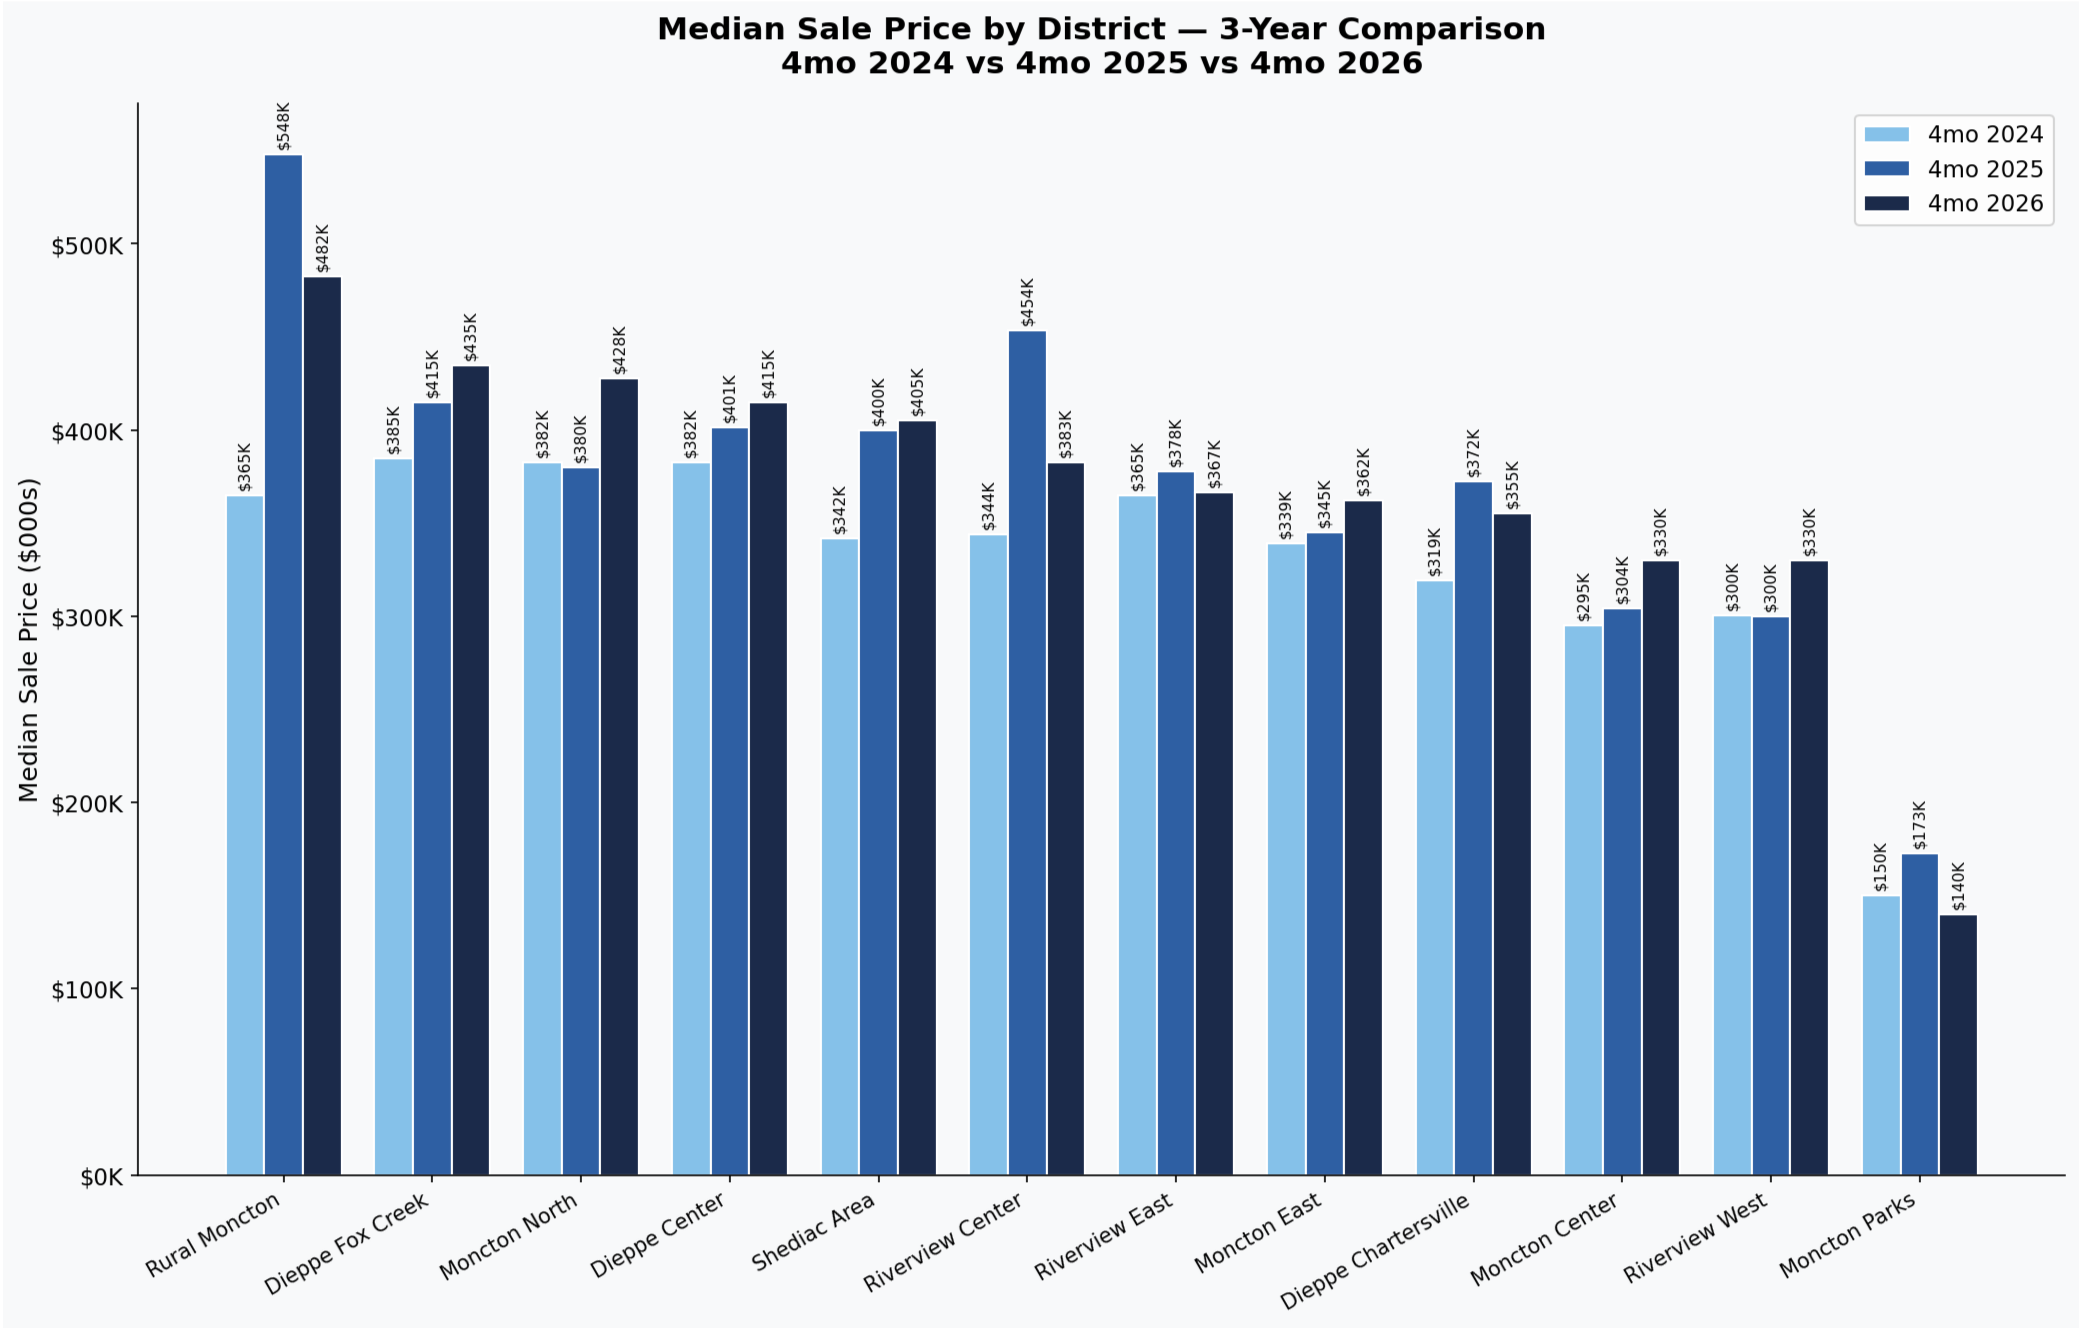
Strongest seller's markets: Riverview West continues to be the tightest market in the region, with just 1.6 months of inventory and a median sale price around $340,000. Riverview Center follows at 2.9 months. Moncton East rounds out the top three at 3.8 months with a notably higher median of $480,000.
Balanced markets: Dieppe Fox Creek sits at 4.6 months of inventory with a median sale price of $508,000. Moncton Center is at 6.3 months with a median of $281,000 - right on the edge of balanced and buyer's market conditions.
Buyer's markets: Shediac sits at 9.2 months of inventory. Dieppe Chartersville is at 9.4 months, and Riverview East stands at 17.0 months - a dramatic outlier that suggests significant oversupply.
Price Band Analysis
Drilling deeper into the data by price band reveals where demand is concentrated. Homes priced below $400,000 continue to sell well relative to available supply. This is the sweet spot of the Greater Moncton market.
Above $600,000, the picture changes. Properties in this range represent approximately 10.6% of active inventory but account for only about 6% of sales. The $800,000-and-above segment is even more stark: these listings make up 7.6% of total inventory but represent just 2.6% of completed sales.
The affordability wall is a real factor. A home priced at $375,000 with a 10% down payment translates to a monthly mortgage payment of approximately $1,900 at current rates. To qualify, a household generally needs an annual income of around $88,000. The median household income in the Greater Moncton area is approximately $80,000.
How Moncton Compares to Other Canadian Markets
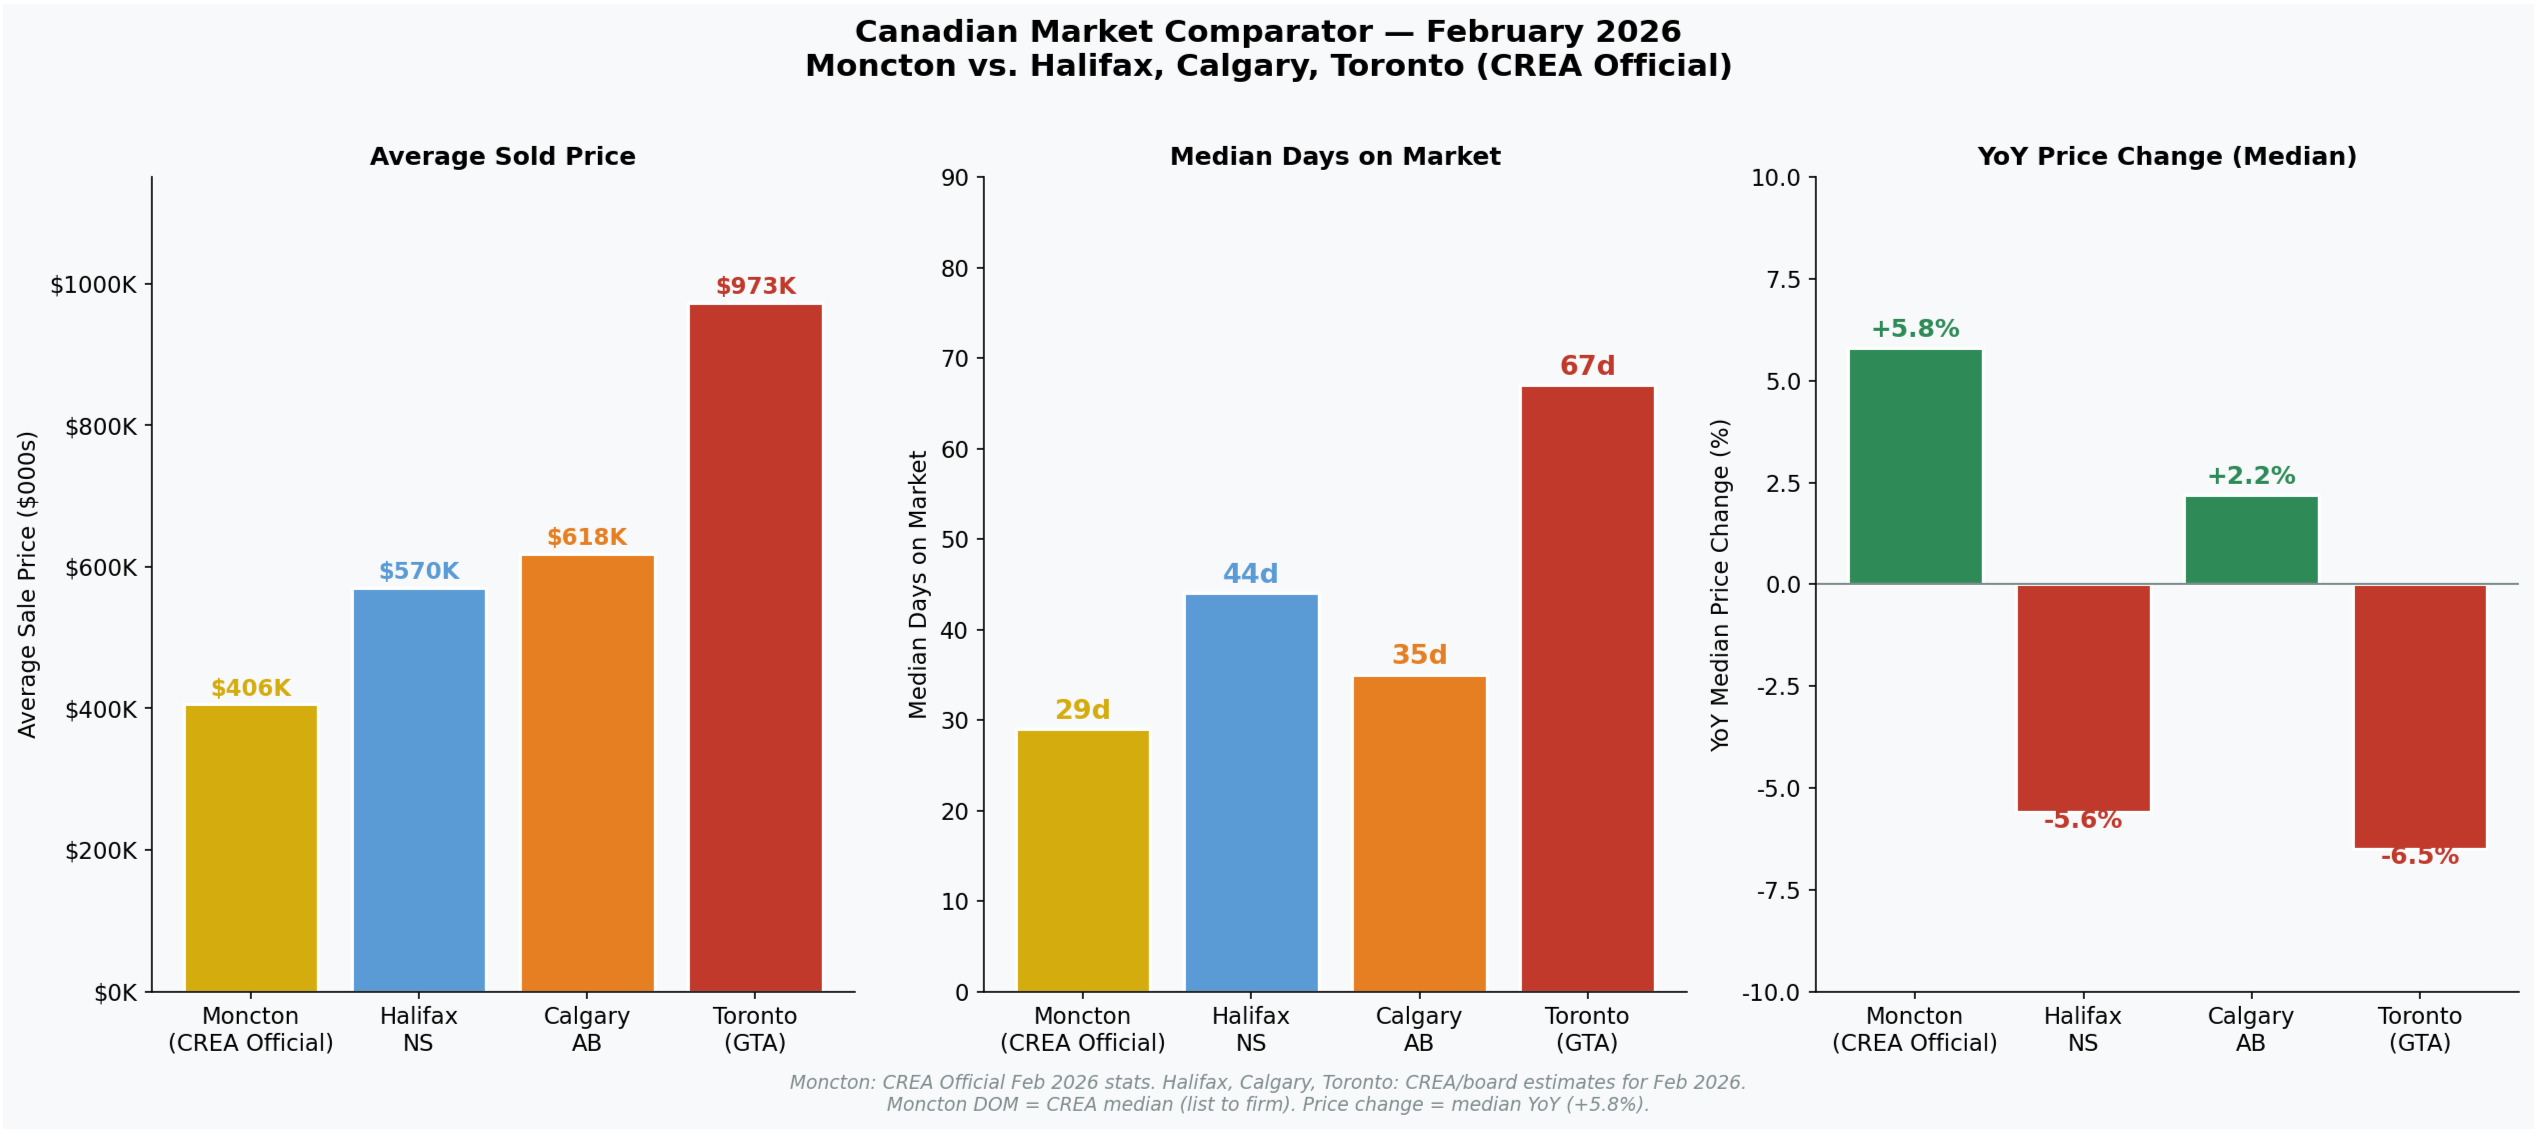
Greater Moncton remains one of the most affordable mid-sized real estate markets in Canada. While the median price of $375,000 is at a record high for the region, it is a fraction of what buyers face in markets like Toronto, Vancouver, or even Halifax.
Moncton is also one of the few Canadian markets where home prices are still appreciating on a year-over-year basis.
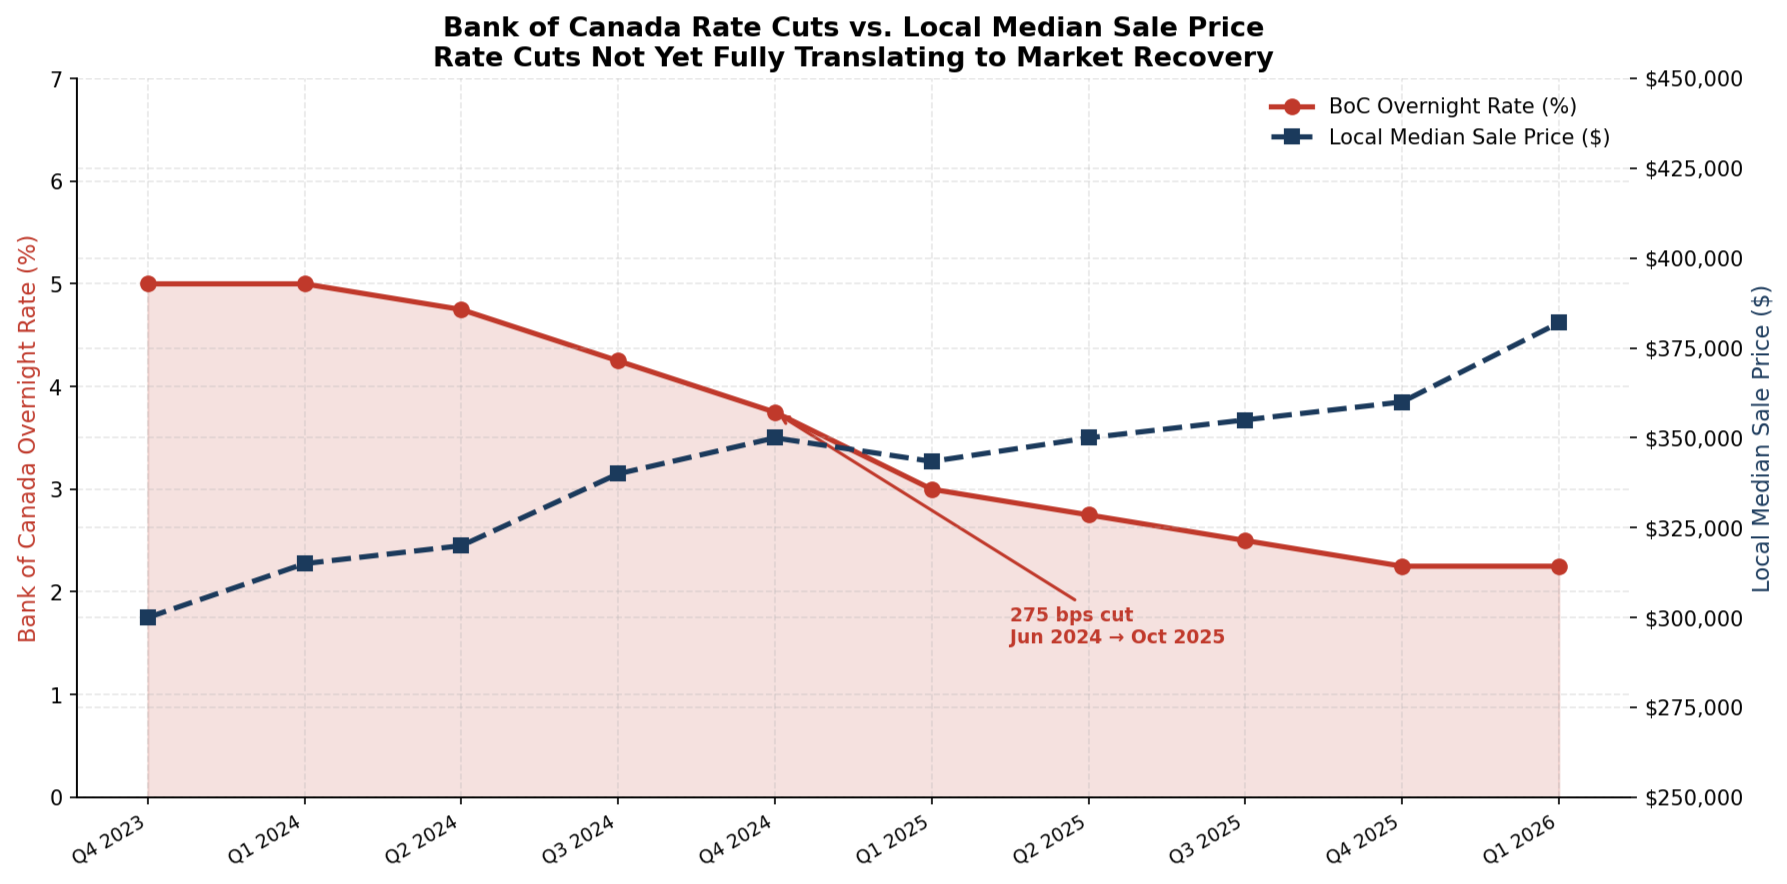
Interest Rates and the Bank of Canada
The Bank of Canada has delivered 275 basis points of rate cuts since June 2024, bringing the overnight rate down significantly from its peak. On paper, this should be a powerful tailwind for the housing market.
In practice, the expected surge in buyer activity has not fully materialized. Rate cuts are a tailwind, not a turbocharger. They are helping to support demand at the margins, but they are not single-handedly driving a resurgence in activity.
Submarket Snapshots: Moncton, Dieppe, Riverview, and Shediac
Moncton: 61 residential sales in February 2026, a decline of 31.5% compared to last year. Active listings at 283, months of inventory at 4.6 months. Median sale price $379,000, up 1.1% year over year. Sale-to-list ratio 97.2%.
Dieppe: 34 sales, a notable 17.2% increase year over year. Active listings at 131, months of inventory at 3.9 months. Median sale price $447,450, a significant 20.3% jump. Sale-to-list ratio 98.6%. Median days on market 18.5 days.
Riverview: 19 sales, down 9.5%. Active listings at 57, months of inventory at 3.0 months - the tightest of the four main submarkets. Median sale price $389,900. Sale-to-list ratio 98.6%.
Shediac: 15 sales with 107 active listings, months of inventory at 7.1 months - firmly in buyer's market territory. Median sale price $420,000, up 15.1% year over year. Sale-to-list ratio 96.6%, the lowest of the four submarkets.
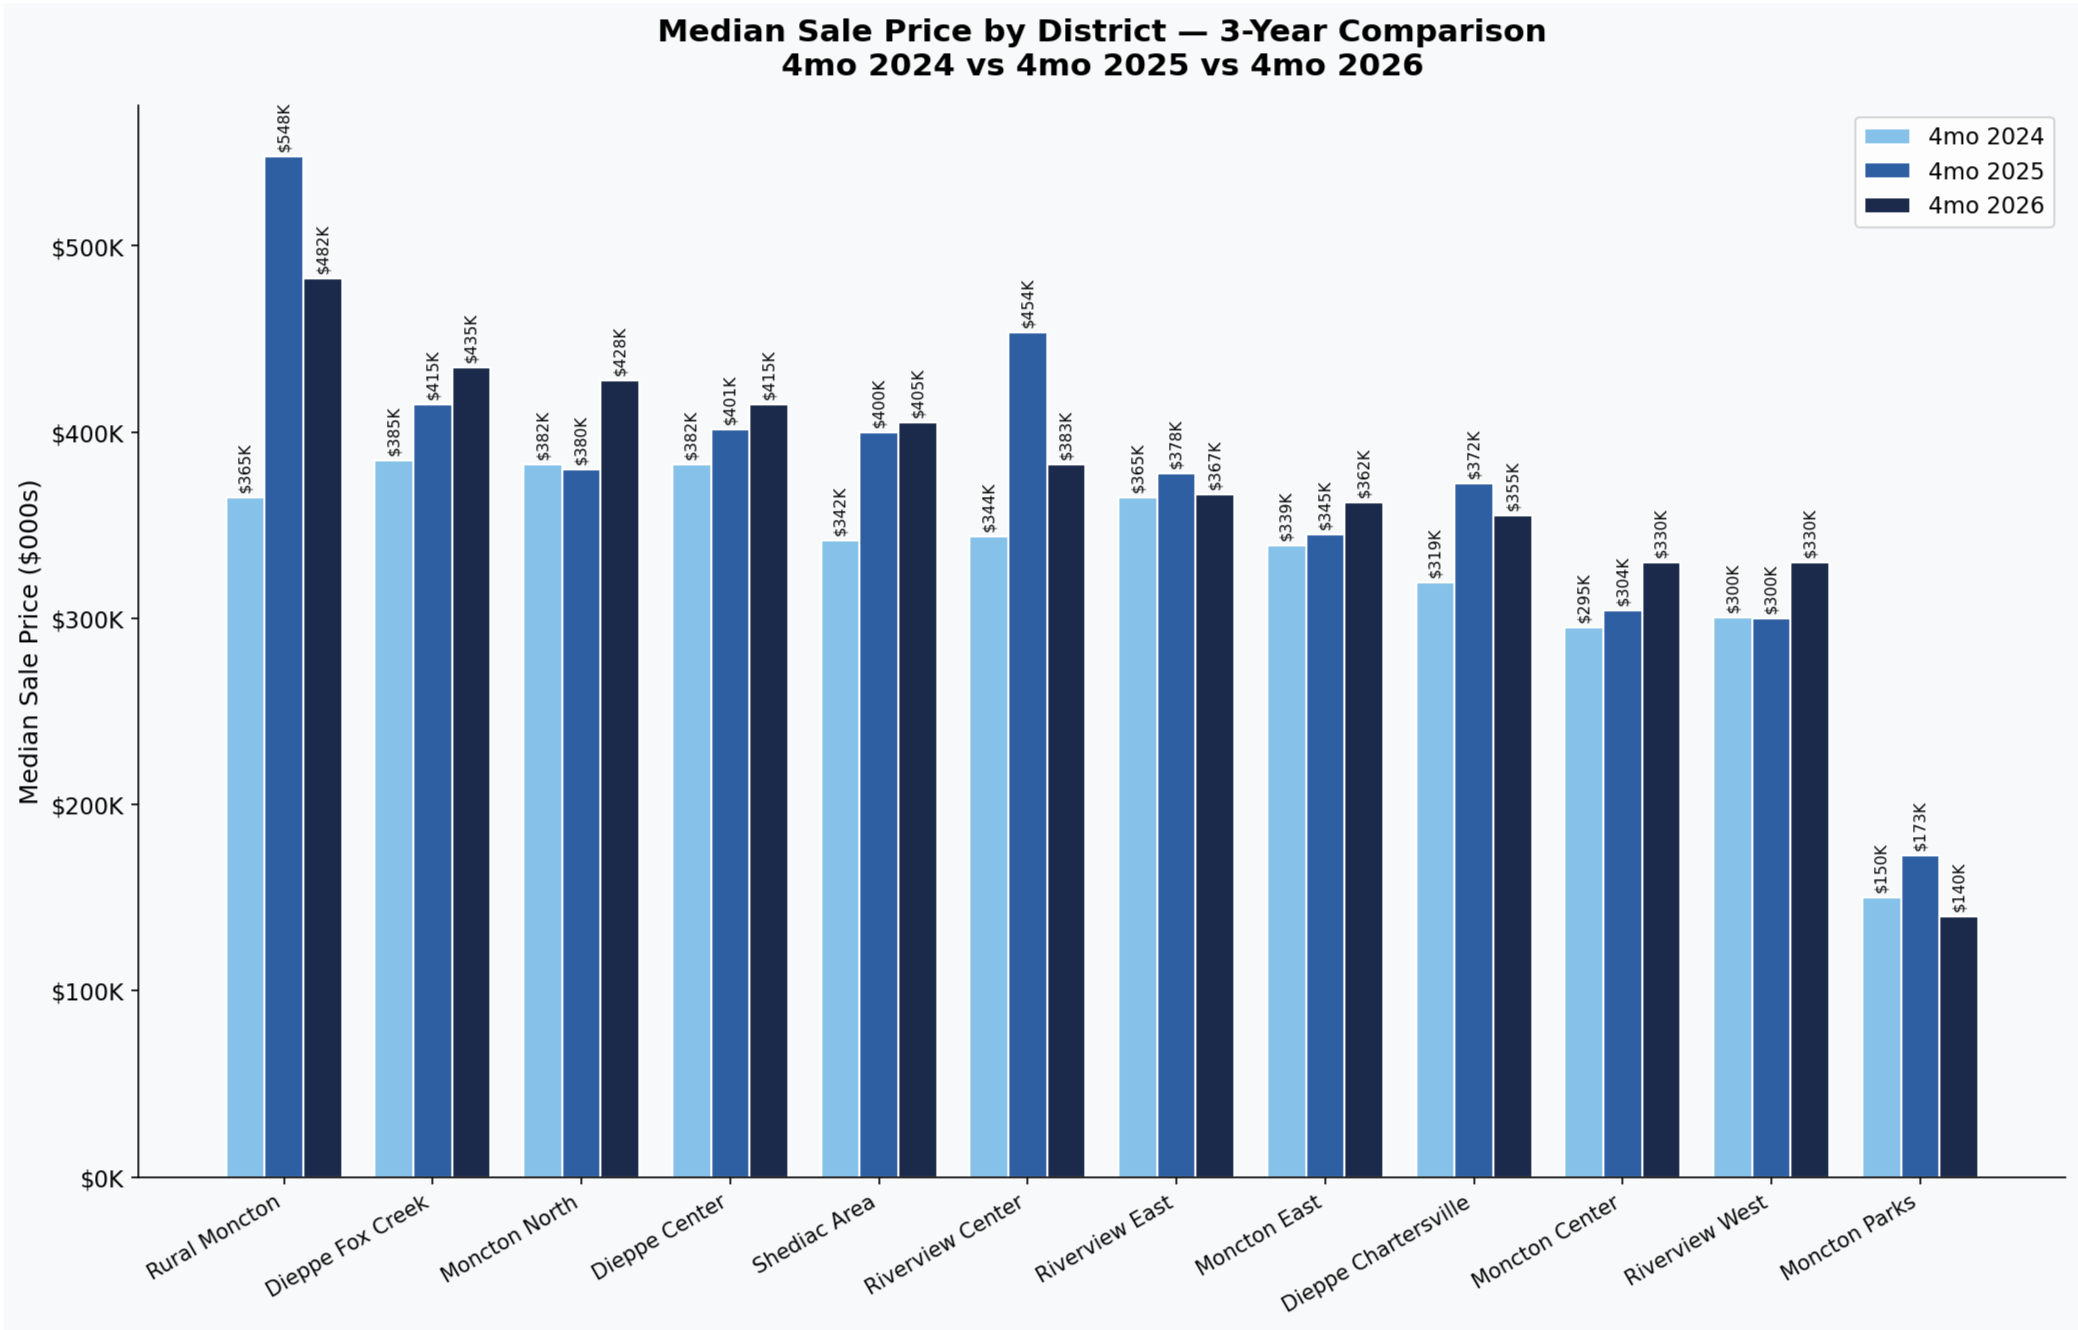
Median Sale Price by District: 3-Year Comparison
A Note on Pricing Strategy
If there is one takeaway from this data, it is this: pricing needs to be rooted in sold data. Not in what you think your home is worth. Not in what your neighbour listed for. Not in "testing the market" to see what happens.
The data is unambiguous. Roughly 50% of properties that expired and re-listed came back at a reduced price. One-third of currently active listings have had at least one price reduction, with the median reduction sitting around $20,000.
Pricing correctly from the start is not conservative - it is strategic. It generates maximum interest, attracts qualified buyers, and positions the property to sell within a reasonable timeframe at or near the asking price.
What This Means for You
If you are a seller: Pricing strategy and marketing quality are more important than ever. You need a pricing strategy grounded in current sold data, professional marketing that makes your property stand out, and an agent who will give you honest feedback rather than telling you what you want to hear.
If you are a buyer: This is a window of opportunity that has not existed in Greater Moncton for several years. With approximately 990 active listings on the market, you have more choice than at any point since 2019. Sellers are more willing to negotiate, days on market are giving you more time to make informed decisions, and interest rates have come down meaningfully from their peak.
If you are a homeowner: The market is not crashing. It is normalizing. If you bought in 2020, 2021, or 2022, you are sitting on significant equity gains. The median price is still climbing year over year.
The Bottom Line
Greater Moncton's real estate market in February 2026 is not crashing. It is undergoing a fundamental recalibration after several years of unprecedented activity and price growth. The market is balanced overall, buyer-favourable in some segments, and still seller-leaning in a handful of tight districts.
The data tells a clear story: sellers who price correctly, market professionally, and work with agents who understand the numbers are still achieving strong outcomes. And buyers who have been patient are finding a market that offers more choice, more leverage, and more time to make confident decisions.
Whether you are buying, selling, or simply keeping an eye on your home's value, the most important thing you can do is work with real data - not headlines, not assumptions, and not emotion.
Frequently Asked Questions
▸What is the median home price in Greater Moncton right now?
As of February 2026, the median sale price in Greater Moncton is $375,000, representing a 5.8% increase compared to February 2025.
▸Is Greater Moncton a buyer's or seller's market?
At 5.4 months of inventory, the overall market is balanced but leaning toward buyer-favourable conditions. However, this varies significantly by district. Riverview West (1.6 months) is a seller's market, while Riverview East (17.0 months) is firmly a buyer's market.
▸Why are so many listings expiring?
The primary driver is pricing. When approximately 69 listings expire for every 100 that sell, it signals that a significant number of properties are entering the market above what buyers are willing to pay.
▸How long are homes taking to sell in Moncton?
Days on market vary widely. Nearly one-third of February 2026 sales had been on the market for 90 days or more. Well-priced properties in active districts like Dieppe are still selling quickly (median of 18.5 days).
▸Is now a good time to buy a home in Greater Moncton?
For buyers with stable employment and a solid financial plan, current conditions offer advantages: roughly 990 active listings (the most since 2019), more negotiating leverage, and interest rates that have come down significantly from their peak.
▸What is the Bank of Canada doing to interest rates?
The Bank of Canada has cut rates by 275 basis points since June 2024. While this has improved affordability and qualifying power, the expected surge in buyer activity has been more measured than anticipated.
▸What is the most affordable area in Greater Moncton?
Moncton Center has the lowest median sale price at $281,000. For buyers seeking newer construction at a moderate price, Riverview West ($340,000 median) offers good value.
▸Which districts are selling the fastest?
Riverview West (1.6 months of inventory), Riverview Center (2.9 months), and Moncton East (3.8 months) are currently the fastest-moving districts. Dieppe also performs well at 3.9 months with a median days-on-market of 18.5 days.